Download

1 / 9
90 likes | 114 Views
Learn how to find a quadratic function that perfectly fits three data points. Practice writing equations and solving systems to create accurate quadratic models. Homework exercises included.

E N D
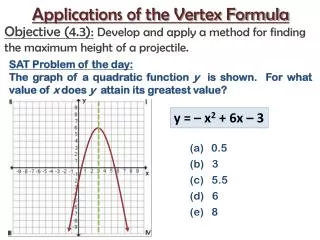
5.7 Curve Fitting With Quadratic Models Objectives: Find a quadratic function that exactly fits three data points Find a quadratic model to represent a data set
Example 1 Find a quadratic equation whose graph contains the points (-3,16), (2,6), and (1,-4). Step 1: Write a system of equations in three variables y = ax2 + bx + c Substitution Equation Point (-3,16) a(-3)2 + b(-3) + c = 16 9a – 3b + c = 16 (2,6) a(2)2 + b(2) + c = 6 4a + 2b + c = 6 a(1)2 + b(1) + c = -4 a + b + c = -4 (1,-4) Step 2: Use a matrix equation to solve the system
Example 1 Find a quadratic equation whose graph contains the points (-3,16), (2,6), and (1,-4). Step 2: Use a matrix equation to solve the system Step 3: Write the quadratic equation
Practice Find a quadratic function whose graph contains the points (2,-3), (4,3), and (6,1).
Homework Lesson 5.7 exercises 1, 4, 5, 13, 15, 17
Example 2 Find a quadratic model to represent the data in the table below. Step 1: Enter the data and make a scatter plot Step 2: Use the quadratic regression feature to find a quadratic model y = 0.008x2 + 0.518x + 131.886
Homework Lesson 5.7 exercises 21-30