
Simplifying Data Analysis with Statistics
E N D
Presentation Transcript
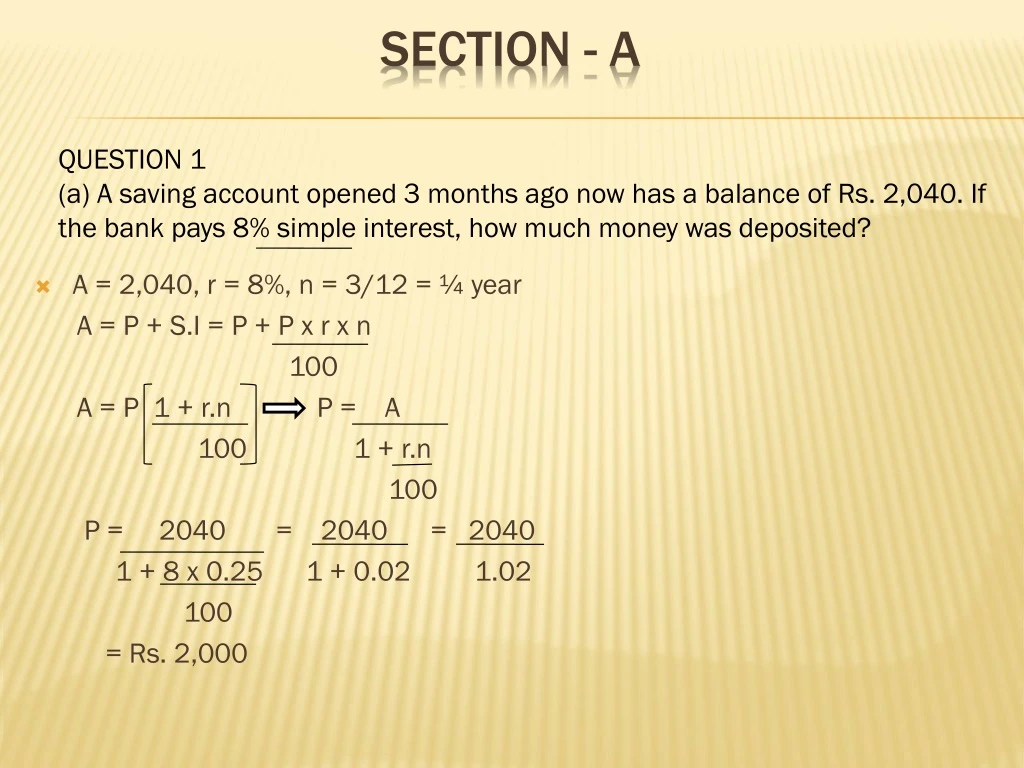
A = 2,040, r = 8%, n = 3/12 = ¼ year A = P + S.I = P + P x r x n 100 A = P 1 + r.n P = A 100 1 + r.n 100 P = 2040 = 2040 = 2040 1 + 8 x 0.25 1 + 0.02 1.02 100 = Rs. 2,000 Section - a QUESTION 1 (a) A saving account opened 3 months ago now has a balance of Rs. 2,040. If the bank pays 8% simple interest, how much money was deposited?
Ques. 1 (d): Find Median Since, we are given the mid-values, we should first find out the upper and lower limits of the various classes. Thus, the class intervals of the mid-values are obtained. Median = Size of {N/2}th item = 100/2 = 50th item Therefore, Median lies in the class 40—50 M = l + N/2 – c.f x i f = 40 + 50-43 x 10 13 = 40 + 5.385 = 45.385
Since we are given inclusive class intervals,we first convert it into exclusive one. By inspection, modal class is 34.5-39.5 Z = l + f1 – f0 x i = 2f1 – f0 – f2 = 34.5 + 10 x 5 40-22 = 34.5 + 50 18 = 34.5 + 2.77 Z = 37.27
Applying binomial Expansion, Since the known values of Y are four, the fourth leading differencewill be zeo. Thus, = y4 – 4y3 + 6y2 -4y1 + y0 Subsituting the values of y’s, we get: = 212 – 4(157) + 6y2 – 4y1 + y0 = 0 6y2 = 628 – 212 + 428 – 100 6y2 = 744 y2 = 124
Ques. Find out the rank correlation. R = 1 – 6 [ ∑D2 + 1/12(N3 – N)2 + … ] N3 – N = 1 – 6 [9.5 + 1/12(33 – 3) + 3/12(23 – 2) ] 73 – 7 = 1 – 6 [9.5 + 2 + 0.5 + 0.5 + 0.5] 336 = 1 – 6(13) = 1- 78 = 1 – 0.232 = 0.768 336 336
Given the following data: N = 8, ∑X = 21 , ∑X2 = 99, ∑Y = 4, ∑Y2 = 68, ∑XY = 36 Find Out: (i) Regression equation X on Y and Y on X (ii) Value of Y when X = 10 and Value of X when Y = 2.5 • Regression Equation of X on Y • X – Xm = bxy (Y – Ym) • X – 2.625 = 0.38 (Y – 0.5) • X – 2.625 = 0.38Y – 0.19 • X = 0.38Y + 2.435 • Regression Equation of Y on X • Y – Ym = byx (X – Xm) • Y – 0.5 = 0.58 (X – 2.625) • Y – 0.5 = 0.58X – 1.5225 • Y = 0.58X – 1.02 • (ii) For X = 10, Y10 = 0.58(20) – 1.02 + 10.58 • For Y = 2.5, X2.5 = 0.38(25) + 2.435 = 3.385 Xm = ∑X = 21 , Ym = ∑ Y = 4 N 8 N 8 = 2.625 = 0.5 bxy = N. ∑XY – ∑X. ∑Y = 8 x 36 – (21)(4) = 288 – 84 N. ∑Y2 – (∑Y)2 8 x 68 – (4)2 544 – 16 = 204 = 0.38 528 byx = N. ∑XY – ∑X. ∑Y = 8 x 36 – (21)(4) = 288 – 84 N. ∑X2 – (∑X)2 8 x 99 – (21)2 792 – 441 = 204 = 0.58 351
Statistics is a mathematical science pertaining to the collection, analysis, interpretation or explanation, and presentation of data. It also provides tools for prediction and forecasting based on data. It is applicable to a wide variety of academic disciplines, from the natural and social sciences to the humanities, government and business. Statistical methods can be used to summarize or describe a collection of data; this is called descriptive statistics. In addition, patterns in the data may be modeled in a way that accounts for randomness and uncertainty in the observations, and are then used to draw inferences about the process or population being studied; this is called inferential statistics. Descriptive, predictive, and inferential statistics comprise applied statistics.
There is also a discipline called mathematical statistics, which is concerned with the theoretical basis of the subject. Moreover, there is a branch of statistics called exact statistics that is based on exact probability statements.The word statistics can either be singular or plural. In its singular form, statistics refers to the mathematical science discussed in this article. In its plural form, statistics is the plural of the word statistic, which refers to a quantity (such as a mean) calculated from a set of data.
FUNCTIONS OF STATISTICS Statistics is used for various purposes. It’s used to simplify mass data and tomake comparisons easier. It’s also used to bring out trends and tendenciesin the data as well as the hidden relations between variables. All this helps tomake decision making much easier. Let us look at each function of statisticsin detail. 1) Statistics simplifies mass data - the use of statisticalconcepts helps in simplification of complex data. Using statisticalconcept, the manager can make decisions more easily. Thestatistical methods help in reducing the complexity of the data andconsequently in the understanding of any huge mass of data.
) Statistics makes comparison easier - Without using statisticalmethods and concepts, collection of data and comparison can’t bedone easily. Statistics helps us to compare data collected fromdifferent sources. Grand totals, measures of central tendency,measures of dispersion, graphs and diagrams, coefficient of correlation all provide ample scopes for comparison.
Limitation of Statistics Now a day’s statistics has become an inevitable part of our life. Though the use and application of statistics isvast, it is not so easy to collect information or data.Rather from the beginning of the collection of data itsanalysis processing and explanation etc. Steps haveample the probability of mistake in its properapplication can be happened. Besides these, statisticshas some limitation, some of which are discussedbelow: • Statistics can analyze only aggregated observation or data :
Statistics given only overall measures: statics gives us only anaverage or overall estimation. It is almostimpossible to achieve a particular result. After aprolonged observation as it is found in otherbranches of knowledge. As the data are influencedby different factors, the some result is notavailable every time. • Statistics rules are mutable : In some brunches of science some unchangeableprinciples and data are available .but in statisticsthey are not found. The principles of statistics arevariable and changeable, approximate etc