Download
1 / 24
240 likes | 266 Views
Learn how to fit models to data using the Hough Transform, tackle challenges like noise and clutter, and apply RANSAC for robust model fitting in data science and image analysis.

E N D
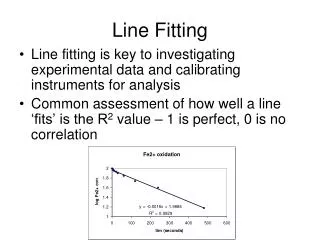
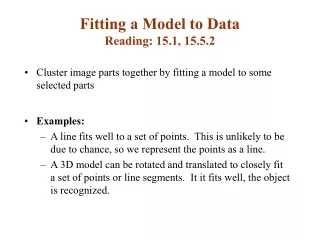
Fitting a Model to DataReading: 15.1, 15.5.2 • Cluster image parts together by fitting a model to some selected parts • Examples: • A line fits well to a set of points. This is unlikely to be due to chance, so we represent the points as a line. • A 3D model can be rotated and translated to closely fit a set of points or line segments. It it fits well, the object is recognized.
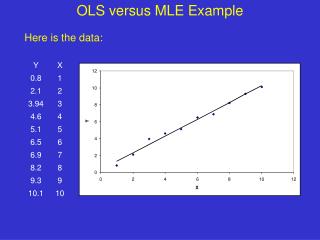
Line Grouping Problem Slide credit: David Jacobs
This is difficult because of: • Extraneous data: clutter or multiple models • We do not know what is part of the model? • Can we pull out models with a few parts from much larger amounts of background clutter? • Missing data: only some parts of model are present • Noise • Cost: • It is not feasible to check all combinations of features by fitting a model to each possible subset
Equation for a line • Representing a line in the usual form, y = mx + b, has the problem that m goes to infinity for vertical lines • A better choice of parameters for the line is angle, θ, and perpendicular distance from the origin, d: x sin θ - y cos θ + d = 0
The Hough Transform for Lines • Idea: Each point votes for the lines that pass through it. • A line is the set of points (x, y) such that x sin θ - y cos θ + d = 0 • Different choices of q, d give different lines • For any (x, y) there is a one parameter family of lines through this point. Just let (x,y) be constants and for each value of q the value of d will be determined. • Each point enters votes for each line in the family • If there is a line that has lots of votes, that will be the line passing near the points that voted for it.
The Hough Transform for Lines d θ Tokens Votes
Hough Transform: Noisy line tokens votes
Mechanics of the Hough transform • Construct an array representing q, d • For each point, render the curve (q, d) into this array, adding one vote at each cell • Difficulties • how big should the cells be? (too big, and we merge quite different lines; too small, and noise causes lines to be missed) • How many lines? • Count the peaks in the Hough array • Treat adjacent peaks as a single peak • Which points belong to each line? • Search for points close to the line • Solve again for line and iterate
Adding more clutter increases number of bins with false peaks.
More details on Hough transform • It is best to vote for the two closest bins in each dimension, as the locations of the bin boundaries is arbitrary. • By “bin” we mean an array location in which votes are accumulated • This means that peaks are “blurred” and noise will not cause similar votes to fall into separate bins • Can use a hash table rather than an array to store the votes • This means that no effort is wasted on initializing and checking empty bins • It avoids the need to predict the maximum size of the array, which can be non-rectangular
When is the Hough transform useful? • The textbook wrongly implies that it is useful mostly for finding lines • In fact, it can be very effective for recognizing arbitrary shapes or objects • The key to efficiency is to have each feature (token) determine as many parameters as possible • For example, lines can be detected much more efficiently from small edge elements (or points with local gradients) than from just points • For object recognition, each token should predict scale, orientation, and location (4D array) • Bottom line: The Hough transform can extract feature groupings from clutter in linear time!
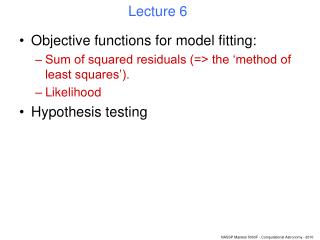
RANSAC (RANdom SAmple Consensus) • Randomly choose minimal subset of data points necessary to fit model (a sample) • Points within some distance threshold t of model are a consensus set. Size of consensus set is model’s support • Repeat for N samples; model with biggest support is most robust fit • Points within distance t of best model are inliers • Fit final model to all inliers Two samples and their supports for line-fitting Slide: Christopher Rasmussen from Hartley & Zisserman
RANSAC: How many samples? How many samples are needed? Suppose w is fraction of inliers (points from line). n points needed to define hypothesis (2 for lines) k samples chosen. Probability that a single sample of n points is correct: Probability that all samples fail is: Choose k high enough to keep this below desired failure rate.
RANSAC: Computed k (p = 0.99) adapted from Hartley & Zisserman Slide credit: Christopher Rasmussen
After RANSAC • RANSAC divides data into inliers and outliers and yields estimate computed from minimal set of inliers • Improve this initial estimate with estimation over all inliers (e.g., with standard least-squares minimization) • But this may change inliers, so alternate fitting with re-classification as inlier/outlier from Hartley & Zisserman Slide credit: Christopher Rasmussen
Automatic Matching of Images • How to get correct correspondences without human intervention? • Can be used for image stitching or automatic determination of epipolar geometry from Hartley & Zisserman Slide credit: Christopher Rasmussen
Feature Extraction • Find features in pair of images using Harris corner detector • Assumes images are roughly the same scale (we will discuss better features later in the course) from Hartley & Zisserman ~500 features found Slide credit: Christopher Rasmussen
Finding Feature Matches • Select best match over threshold within a square search window (here 300 pixels2) using SSD or normalized cross-correlation for small patch around the corner from Hartley & Zisserman Slide credit: Christopher Rasmussen
Initial Match Hypotheses 268 matched features (over SSD threshold) in left image pointing to locations of corresponding right image features Slide credit: Christopher Rasmussen
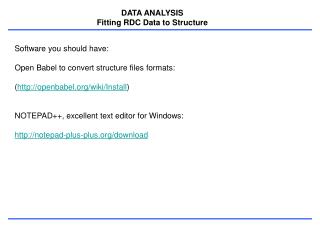
Outliers & Inliers after RANSAC • n is 4 for this problem (a homography relating 2 images) • Assume up to 50% outliers • 43 samples used with t = 1.25 pixels from Hartley & Zisserman 151 inliers 117 outliers
Discussion of RANSAC • Advantages: • General method suited for a wide range of model fitting problems • Easy to implement and easy to calculate its failure rate • Disadvantages: • Only handles a moderate percentage of outliers without cost blowing up • Many real problems have high rate of outliers (but sometimes selective choice of random subsets can help) • The Hough transform can handle high percentage of outliers, but false collisions increase with large bins (noise)