Download
1 / 25
250 likes | 271 Views
Discover how to interpret and correct data errors using graphs and visuals in ZIMS, maximizing the utility of the vast amounts of entered data. Learn to compare, analyze, and predict trends in animal data effortlessly.

E N D
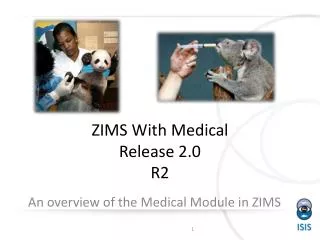
Painting Pictures with ZIMS Data With the help of Vincent Van Gogh Graphs and Visuals in ZIMS October 2019 TNT
Data, data, data. All those years of entering data into ZIMS, or previously into ARKS, provides you with a lot of useful information. But how do you quickly interpret nine pages of weights on Bob your orangutan? And the ins and outs of your walking stick group have you befuddled. ZIMS provides many visuals via graphs and charts that help you quickly understand all that data. There are also some visuals that incorporate data entered by other institutions for easy comparison.
Single Measurements We have 9 pages of weights on Bob, an orangutan, recorded by 2 facilities, ours and where we sent him. We’d like to see if Bob is continuing to grow. A quick view of his weight graph shows us that he is gaining weight as he should. But what are these weights?
Fix the Data! Hovering over the dots on the graph will give us the dates those weights were recorded and the UOM. Looking at the weight grid we find that on those days the weights were recorded in kilograms and not pounds. We fix them and rerun the graph. Now that looks a lot better! Painting pictures can help you correct data entry mistakes!
Weight Comparison Bob had always been on the thin side when you had him and you are wondering if, as he got older, he was able to catch up with average weights for other males. Comparing Bob’s weight with global data, you are happy to see that Bob is now right in the middle of what other male orangutans of his age weigh. Painting pictures can set your mind at ease.
Animal Graphing Tool The Animal Graphing Tool allows you to compare multiple animals and multiple measurement types (weights, lengths, Feed Log info). Above we are comparing the weights of two colobus records and find the same data entry error. However, this one was entered in the Medical module so it must be corrected from there. But the graph does show that something was going on with M15010 that was not going on with M16026.
Animal Graphing Tool Reviewing the Notes around the time she began losing weight you see that her six month old offspring had recently died. The offspring had been sickly for the prior month. Caring for a compromised offspring and then experiencing its loss explains the weight loss indicated on the graph. Painting pictures can show you indicators that further research is needed!
Group Explorer The long My Transactions stream for your group of grey tree frogs has you quite confused. So many comings and goings it is hard to sort them out. By pulling the group up in Group Explorer it is easy to see the incoming (left side) and the outgoing (right side) activity in the group. Painting pictures helps you see clearly now.
Pedigree Explorer Pedigree Explorer can be viewed from the animal record or from Tools. You can select to view Parents, Descendants and Siblings for the animal in focus. Above we are looking at Parents for a giraffe. Painting pictures can be a family affair!
Environmental Quality Graph The Environmental Quality Graphs let you graph single measurements on a single exhibit, multiple measurements on a single exhibit, single measurements on multiple exhibits and multiple measurements on multiple exhibits! Below we are looking at three pools and two measurements (1). The y axis shows the separate measurements (2). It is easy to see that for all exhibits, the higher the water temperature is the lower the pH. Painting pictures helps you quickly spot trends to help you better care for your animals!
Care & Welfare The Care and Welfare module helps you monitor the mental and physical welfare of your animals. You configure welfare Indicators as you wish and create Templates for animals that you want to quickly capture that data on. You can then graph the data for easy interpretation of the welfare status of the animal. The Como Zoo used Care and Welfare module to help them identify an illness in one of their bearded emperor tamarins.
Care & Welfare This is the Care and Welfare graph post surgery. The graphs make it easy to see when things have gone awry and when things are back to normal. Painting pictures lets you quickly catch trends in the welfare of your animals!
You are wondering if your flamingo colony will be able to continue to reproduce in the coming years. Looking at an Age Distribution chart you note that you only have 7 birds under the age of 12 in your flock of over 80 birds. It appears that your older flock has not been producing enough recent offspring to maintain the flock in the future. You decide to look in to acquiring some younger animals to increase the breeding activityor determine why the reproduction is low. Painting pictures can help you predict the future. Age Distribution
Animal Charts The Animal Charts found under Start > Animals > Charts let you look at your collection or all of ZIMS by Taxonomy / Animal or Birth Type and IUCN/CITES status. The Taxonomy / Animal Type tab displays a bar graph by My Institution or All ZIMS by Animal Count or Species Count. Painting pictures can give you a quick visual to see what taxa are over or under represented if you desire a balanced collection.
Animal Chart The graph by Taxonomy / Birth Type provides a comparison of Animal Counts (Species Counts is not available here) for Wild versus Captive Births divided into your Current and Historical collection. Painting pictures can show how your institution maintains captive bred animals rather than depending on wild captures.
Animal Charts The remaining four Charts graph by IUCN and CITES status. The IUCN At Risk graph displays how your collection compares with others in managing species that are At Risk. This institution has a high number of IUCN At Risk species in its collection. Painting pictures can show you how involved you are with helping endangered and threatened species!
Data Sharing The Data Sharing Maps found under Institution > Data Management give you a quick view of the institutions you are sharing records with (left) and the other institutions that are sharing their records with you (right). Hovering over the dot will display the institution name and number of records shared. Clicking on any of the lines will bring up a list of the institutions. Painting pictures lets you see that Sharing is Caring.
Data Quality Another tab under Data Management that can really help you out is Data Quality. This pie chart indicates records with no Data Quality issues (great!) , those records with Warnings (data should be corrected when possible) and those with actual Errors (these records need help!). Drilling down through the pie slices will lead you to a list of records that contain that type of Warning or Error. You can make sure you are addressing the records in the right order by limiting the graph to IUCN Priority Filters. Painting pictures helps ensure that your ZIMS records are of the highest quality!
Species360 Members ZIMS visuals often display information about our member institutions and not just their animal collections. Look for member maps under Start > Institution > Member Maps. You have booked a car for your Australian adventure and want to visit as many Australian zoos and aquariums as you can. Using the Species360 Member Categories limited to Zoos and Aquariums, you get a quick view of what institutions you can visit in the area you will be visiting. Painting pictures helps you plan your vacation!
Species Event History Have some popcorn and want to do some binge watching? Go to Reports > Species Event History and type in your favorite species. A year by year visualization of Births/Hatches, Wild Captures and Moves will display. You can select by scope from Global down to your institution. Painting pictures has some movie options!
Studbook Charts The Studbook Charts will display the number of Studbook Keeper assignments in ZIMS by Class. If you are a Regional Association ZIMS User, you can also see the chart by Studbook Keeper Assignments for your Association. Clicking on the bars will bring up a list of the assigned species, the Studbook Keeper and their institution. Painting pictures keeps you studbook savvy.
Drug Usage Extract Some of the ZIMS Global Resources also have options for visualizing the data presented. In the Drug Usage Extract select to View Distribution for a global representation of where the data came from. Above is for the use of injectable Ivermectin in cheetahs. This visualization is also available in Anesthesia Summaries. Painting pictures can let you see what drugs are used in your region.
Relevant Death Information Running the Global Medical Resource of Morbidity & Mortality for Relevant Death Information and selecting My Institution will produce bar graphs that allow you to drill down in your records and find any RDI records that are incomplete, conflicting or suspicious. Once you reach the final bar graph a results grid will display with the records in question. Painting pictures lets you complete that final record on your animals.
Population Overview One very popular ZIMS visualization is the Population Overview resource. This resource has been used by population managers to help make species decisions. This resource has three visuals: 1) Transactions by Year, 2) Population and Holders by Year and 3) Age Graph. Painting a picture of the status of a species can help make population management easier.
Painting Pictures in ZIMS! Visualize Your Data!