Download
1 / 14
140 likes | 169 Views
This workshop explores surface characterization using hyperspectral data, focusing on MODIS base map conversion to emissivity, cloud detection elimination, and soil emissivity assessment using ASTER library. Enhance simulation techniques for future applications.

E N D
Surface Characterization 3rd Annual Workshop on Hyperspectral Meteorological Science of UW MURI And Beyond University of Hawai’i Paul G. Lucey Co-Investigator
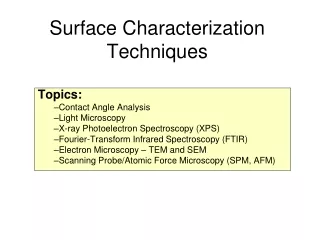
Surface Emissivity Simulation • Use multispectral infrared satellite data as base map • Fit infrared multispectral data with hyperspectral library data • Produce continuous sampled spectrum at each pixel
Base Map • Data from MODIS • Convert to emissivity • Detect and eliminate clouds • Produce mosaic of simulation area
MODIS features several bands with weak atmospheric extinction appropriate for surface characterization
Estimate of MODIS surface emissivity MODTRAN coupled with aerosonde measurements provides atmospheric transmission, up and downwelling radiance. Assume no multiple scattering Lsat=Latm_upwelling+[B(T)e+L atm_downwelling*(1- e)]*tatm At 11 microns assumee=1 to establish surface temperature Solve for e at all wavelengths
High visible radiance Low infrared radiance Change detection Mask detections, average emissivities of non-cloudy areas Residual clouds set to blackbody radiances at mean surface temperature Cloud Detection and Removal
Extract soil emissivities at MODIS wavelengths (assumine Kirchoff’s Law) from ASTER spectrum library (41 soils) Treat ASTER soils as lookup table Compare each MODIS spectrum to lookup table and return soil sample# for closest fit (by RMS differences) Insert full resolution ASTER spectrum at each location Emissivity assignment
MODIS Emissivity Type Map Spatial resolution: 1km Wavelength range: 685-2250 cm-1 Wavelength sampling: 2 cm-1 Spectral channels: 801
Dynamic emissivity Vegetation senescence Surface moisture “Ground truth” using data from ASTER Simulation Improvements for Following Year