Download
1 / 25
260 likes | 300 Views
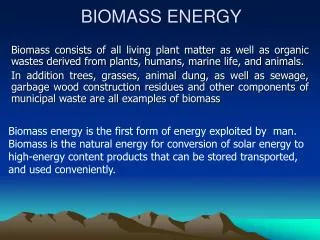
Energy from Waste & Biomass. Really Zero Waste 11 th March 2009 Institute of Materials and Mining, London Peter Jones, OBE ecolateraljones@btinternet.com. ‘ Lasting’ Products 1%. Dredgings 4%. Air Emissions 34%. Mining Waste 20%. Landfill 15%. Agricultural Waste 16%. Sewage 5%.

E N D
Energy from Waste & Biomass Really Zero Waste 11th March 2009 Institute of Materials and Mining, London Peter Jones, OBE ecolateraljones@btinternet.com
‘Lasting’ Products 1% Dredgings 4% Air Emissions 34% Mining Waste 20% Landfill 15% Agricultural Waste 16% Sewage 5% Recycling 5% Total UK Raw Resource Usage and Disposal per Annum (excludes water) Matter can neither be created nor destroyed UK Disposal Inputs Use 1200 million tonnes 1200 million tonnes 600 million tonnes Public Sector Goods Not Measured Other16% Industrial Goods Not Measured Minerals and Rock 50% Overseas impacts 600 million tonnes 600 million tonnes (raw resources - UK) 570 million tonnes (wastage - UK) Overseas impacts 600 million tonnes Power Transport & Heat 34% Packaging 3% Fossil Fuels 34% Consumer Goods 10% 70 million tonnes re-use - UK
ATTITUDE TECHNOLOGY ECONOMICS The Three Musketeers of Policy Implementation
Recycler The Carbon Competitors Energy Boy Landfiller Composter Form Long term - Handicaps- Planning Consents - Taxes- Better odds elsewhere - Traded Permits- Renewable targets - Import dependency on rivals- Rising logistics costs- High value prizes- Improving technology • Low value prizes- Staying power • Plenty of local runners • Cheap setup • Soils directive • Low distribution costs • EU targets • Energy trends • High value prizes • Traded Permits • Producer reuse Early Faller Expensive Thoroughbred Regular Winner Stayer Good ValueAll Rounder
Tonnes to Landfill (millions) £ Gate Fee 100 100 Tonnage Inputs 90 90 80 80 70 70 60 60 50 50 40 40 Gate Fee per tonne 30 30 Operator Fee per tonne 20 20 10 10 1997 2000 2002 2004 2006 2008 2010 2012 Timing the Landfill Transition 2007 ?
Bedfordia Biogen Plant, Milton Ernest Source: BIOGEN
Biffa-Leicester MHW Treatment New cascade ball mill-Bursom
Willesden: A Typical Shredder 350,000 tpa vehicles and white goods & other light iron Licensed, paved and full drainage Rail sidings and loading equipment Weighbridges, offices and communications Experienced management and data handling Source: EMR
MBT in Action: Waste is Shredded at Ecodeco’s Montanaso Plant in Italy
Central BottlingOverview of tank system where digestion occurs
Marchwood EFW 165,000 tpa Source: Veolia
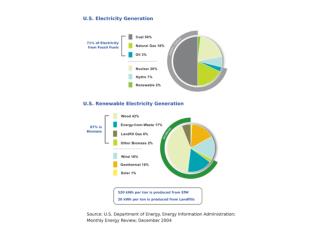
The Lights Go Out??? Source: DTI
200 5000 x 500kW CHP units +18% fuel economy for all cars 4 x 800 MW nuclear reactors 100 2500 x 500kW biomass CHP 5000 x 2MW wind turbines 200 million X 1m2 PV panels 1 Severn Barrage 10% transport biofuels Meeting the Energy Challenge TWhr 0 2006 2020 Each wedge = 17 TWh
The Hierarchy of Policy Material Flow Mapping • National Level • Carbon footprinting methodology • Legal frameworks for special purpose • Regional Level • Co-located mapping of fossil energy sinks • Planning spatial strategy • Co-funding shares in SPVs • Resources Sector • Risk takers on fuel feedstock • Risk takers on energy off take • Risk takers on energy demand • Risk takers on technology
1 tonne bale of waste floc The Resources Hierarchy Value by Financial and Fossil Carbon Tradeoffs • Compost/fertiliser soil fuels • Recycling into new materials • Anaerobic digestion • Gasification/steam turbine • Gasification/internal combustion • Gasification/hydrogen/fuel cells
The Regional Government Role • Identify fossil energy sinks, which are • Long term stayers • On good logistics infrastructure • Away from housing • Adjacent to land owned by the RDA • On contaminated sites • Near feedstock sources • On secondary power grid networks • Establish planning based impact criteria • Establish local community benefit/planning gain • Identify possible SPV structures for ESCOs
What Comprises Good Target Fossil Sinks? • Food chain RDCs/freezer centres/food preparation/retail complexes • Diversified industrial estates • Hospitals • Prisons • Bus and truck complexes • Docks • Airports • Data centres • Linear energy distribution pipes and wires • Confectionary factories • Sewage plants • Road fuel distribution depots • Industrial gases operations