Download
1 / 25
300 likes | 562 Views
Learn about sequence and collaboration diagrams in UML, illustrating system dynamics. Interaction diagrams display object interactions, including message dispatch. Sequence diagrams emphasize message order, while collaboration diagrams emphasize object organization.

E N D
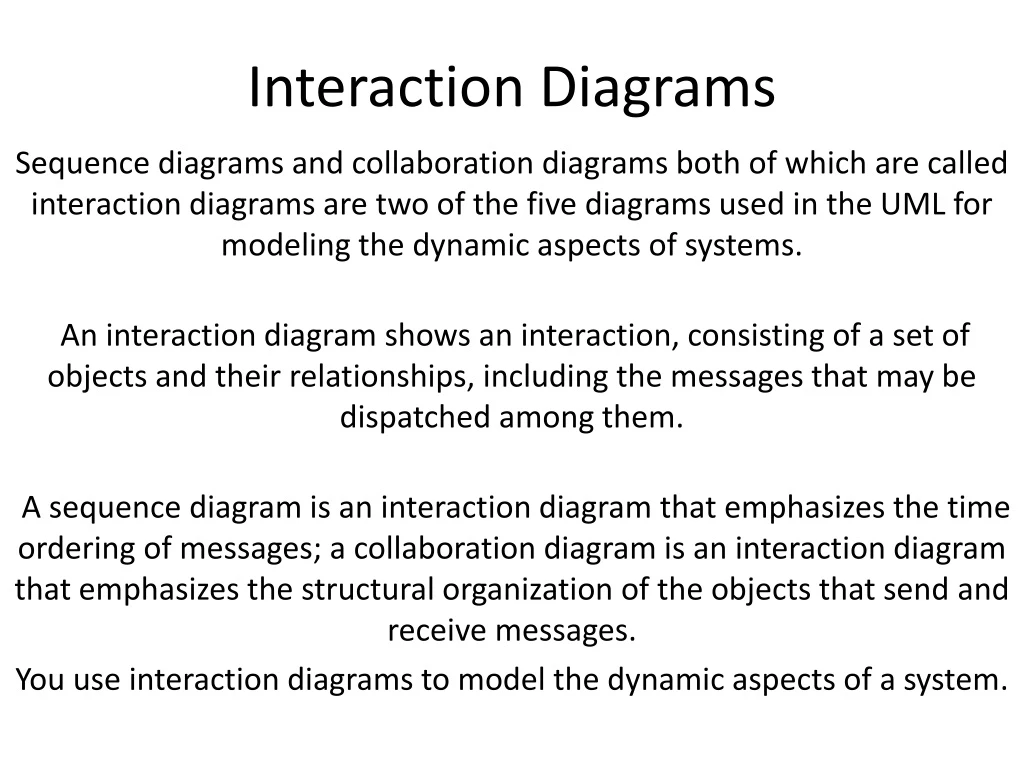
Interaction Diagrams Sequence diagrams and collaboration diagrams both of which are called interaction diagrams are two of the five diagrams used in the UML for modeling the dynamic aspects of systems. An interaction diagram shows an interaction, consisting of a set of objects and their relationships, including the messages that may be dispatched among them. A sequence diagram is an interaction diagram that emphasizes the time ordering of messages; a collaboration diagram is an interaction diagram that emphasizes the structural organization of the objects that send and receive messages. You use interaction diagrams to model the dynamic aspects of a system.
An interaction diagram shows an interaction, consisting of a set of objects and their relationships, including the messages that may be dispatched among them. • A sequence diagram is an interaction diagram that emphasizes the time ordering of messages. • Graphically, a sequence diagram is a table that shows objects arranged along the X axis and messages, ordered in increasing time, along the Y axis. • A collaboration diagram is an interaction diagram that emphasizes the structural organization of the objects that send and receive messages. • Graphically, a collaboration diagram is a collection of vertices and arcs.
Common properties • An interaction diagram is just a special kind of diagram and shares the same common properties as do all other diagrams a name and graphical contents that are a projection into a model. • What distinguishes an interaction diagram from all other kinds of diagrams is its particular content.
Contents • Interaction diagrams commonly contain • · Objects • · Links • · Messages Note • An interaction diagram is basically a projection of the elements found in an interaction. • The semantics of an interaction's context, objects and roles, links, messages, and sequencing apply to interaction diagrams. • Like all other diagrams, interaction diagrams may contain notes and constraints.
Sequence Diagrams • A sequence diagram emphasizes the time ordering of messages. You form a sequence diagram by first placing the objects that participate in the interaction at the top of your diagram, across the X axis. • Typically, you place the object that initiates the interaction at the left, and increasingly more subordinate objects to the right. • Next, you place the messages that these objects send and receive along the Y axis, in order of increasing time from top to bottom. • This gives the reader a clear visual cue to the flow of control over time.
Sequence diagrams have two features that distinguish them from collaboration diagrams. • First, there is the object lifeline. An object lifeline is the vertical dashed line that represents the existence of an object over a period of time. • Most objects that appear in an interaction diagram will be in existence for the duration of the interaction, so these objects are all aligned at the top of the diagram, with their lifelines drawn from the top of the diagram to the bottom. • Objects may be created during the interaction. Their lifelines start with the receipt of the message stereotyped as create. • Objects may be destroyed during the interaction. Their lifelines end with the receipt of the message stereotyped as destroy (and are given the visual cue of a large X, marking the end of their lives).
Second, there is the focus of control. The focus of control is a tall, thin rectangle that shows the period of time during which an object is performing an action, either directly or through a subordinate procedure. • The top of the rectangle is aligned with the start of the action; the bottom is aligned with its completion (and can be marked by a return message). • You can show the nesting of a focus of control (caused by recursion, a call to a self-operation, or by a callback from another object) by stacking another focus of control slightly to the right of its parent (and can do so to an arbitrary depth). • If you want to be especially precise about where the focus of control lies, you can also shade the region of the rectangle during which the object's method is actually computing (and control has not passed to another object).
Collaboration Diagrams • A collaboration diagram emphasizes the organization of the objects that participate in an Interaction. • you form a collaboration diagram by first placing the objects that participate in the interaction as the vertices in a graph. • Next, you render the links that connect these objects as the arcs of this graph. Finally, you adorn these links with the messages that objects send and receive. • This gives the reader a clear visual cue to the flow of control in the context of the structural organization of objects that collaborate.
Collaboration diagrams have two features that distinguish them from sequence diagrams. • First, there is the path. To indicate how one object is linked to another, you can attach a path stereotype to the far end of a link (such as <<local>>, indicating that the designated object is local to the sender). • Typically, you will only need to render the path of the link explicitly for local, parameter, global, and self (but not association) paths.
Second, there is the sequence number. To indicate the time order of a message, you prefix the message with a number (starting with the message numbered 1), increasing monotonically for each new message in the flow of control (2, 3, and so on). • To show nesting, you use Dewey decimal numbering (1 is the first message; 1.1 is the first message nested in message 1; 1.2 is the second message nested in message 1; and so on). You can show nesting to an arbitrary depth. • Note also that, along the same link, you can show many messages (possibly being sent from different directions), and each will have a unique sequence number.
Semantic equivalence • Common Uses : • When you model the dynamic aspects of a system, you typically use interaction diagrams in two ways. • 1. To model flows of control by time ordering • Here you'll use sequence diagrams. Modeling a flow of control by time ordering emphasizes the passing of messages as they unfold over time, which is a particularly useful way to visualize dynamic behavior in the context of a use case scenario. • Sequence diagrams do a better job of visualizing simple iteration and branching than do collaboration diagrams.
2. To model flows of control by organization • Here you'll use collaboration diagrams. Modeling a flow of control by organization emphasizes the structural relationships among the instances in the interaction, along which messages may be passed. • Collaboration diagrams do a better job of visualizing complex iteration and branching and of visualizing multiple concurrent flows of control than do sequence diagrams.
Common Modeling Techniques - Modeling Flows of Control by Time Ordering • To model a flow of control by time ordering, Set the context for the interaction, whether it is a system, subsystem, operation, or class, or one scenario of a use case or collaboration. • Set the stage for the interaction by identifying which objects play a role in the interaction. Lay them out on the sequence diagram from left to right, placing the more important objects to the left and their neighboring objects to the right.
Set the lifeline for each object. In most cases, objects will persist through the entire interaction. For those objects that are created and destroyed during the interaction, set their lifelines, as appropriate, and explicitly indicate their birth and death with appropriately stereotyped messages. • Starting with the message that initiates this interaction, lay out each subsequent message from top to bottom between the lifelines, showing each message's properties (such as its parameters), as necessary to explain the semantics of the interaction. • If you need to visualize the nesting of messages or the points in time when actual computation is taking place, adorn each object's lifeline with its focus of control.
Consider the objects that live in the context of a system, subsystem, operation, or class. Consider also the objects and roles that participate in a use case or collaboration. To model a flow of control that winds through these objects and roles, you use an interaction diagram; to show the passing of messages in the context of that structure, you use a collaboration diagram, a kind of interaction diagram. Set the context for the interaction, whether it is a system, subsystem, operation, or class, or one scenario of a use case or collaboration.
Set the stage for the interaction by identifying which objects play a role in the interaction. Lay them out on the collaboration diagram as vertices in a graph, placing the more important objects in the center of the diagram and their neighboring objects to the outside. • Set the initial properties of each of these objects. If the attribute values, tagged values, state, or role of any object changes in significant ways over the duration of the interaction, place a duplicate object on the diagram, update it with these new values, and connect them by a message stereotyped as become or copy (with a suitable sequence number).
Specify the links among these objects, along which messages may pass. • 1. Lay out the association links first; these are the most important ones, because they represent structural connections. • 2. Lay out other links next, and adorn them with suitable path stereotypes (such as global and local) to explicitly specify how these objects are related to one another.
Starting with the message that initiates this interaction, attach each subsequent message to the appropriate link, setting its sequence number, as appropriate. Show nesting by using Dewey decimal numbering. • If you need to specify time or space constraints, adorn each message with a timing mark and attach suitable time or space constraints. • If you need to specify this flow of control more formally, attach pre- and post conditions to each message.
Forward and Reverse Engineering • Forward engineering (the creation of code from a model) is possible for both sequence and collaboration diagrams, especially if the context of the diagram is an operation. • For example, using the previous collaboration diagram, a reasonably clever forward engineering tool could generate the following Java code for the operation register, attached to the Student class.
public void register() { CourseCollection c = getSchedule(); for (inti = 0; i < c.size(); i++) c.item(i).add(this); this.registered = true; }