Principal Component Analysis (PCA)
Principal Component Analysis (PCA). Principal component analysis (PCA) creates new variables (components) that consist of uncorrelated, linear combinations of the original variables.

Principal Component Analysis (PCA)
E N D
Presentation Transcript
Principal Component Analysis (PCA) • Principal component analysis (PCA) creates new variables (components) that consist of uncorrelated, linear combinations of the original variables. • PCA is used to simplify the data structure and still account for as much of the total variation in the original data as possible.
Simple Case: Stock Market Data Can the data be reduced to just one linear combinations of the original variables be used without loosing much information?
3 Steps for PCA • Calculate the correlation matrix • Calculate the eigenvectors of the correlation matrix • Multiply the eigenvectors by the standardized original data. The first principal component (PC1) is a linear combination of the standardized data where the first eigenvector is used as the weights.
Simple Case: Stock Market Data Standardized closing values of 2006 Dow Index vs 2006 S&P 500
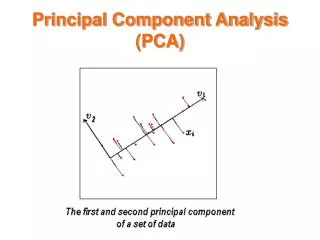
Simple Case: Stock Market Data Direction of first principal component (the first eigenvalue).
Simple Case: Stock Market Data Rotating the data to the first principal component. PC1 is a linear combination of the standardized data with the first eigenvector is used as the weights.
LAB:Principal Component Analysis in Environmental StudiesThe Debate Over Statistical Techniques Used in the Derivation of the Global Warming Hockey Stick Graph Figure 1:The instrumental record of global average temperatures.
The Hockey Stick Graph Figure 2: Mann’s 1998 Hockey Stick Graph
The Hockey Stick Graph Figure 2: Mann’s 1998 Hockey Stick Graph
The Hockey Stick Graph • In 1998 Mann, Bradley, and Hughes (MBH) used a modified PCA to reduce 70 series of proxy data to one principal component (PC1). • MBH’s graph was widely used as evidence of global warming. • In 2003 McIntyre and McKitrick (MM), claimed that the graph was not correct – but had a significant amount of trouble getting published. • In 2005 MM published a simulation study that showed that MBH’s modified PCA technique would consistently result in a hockey stick shape. • In 2006 Ed Wegman provided an ad-hoc committee report to congress on the “Hockey Stick Global Climate Reconstruction”, http://www.heartland.org/pdf/19383.pdf .
The Hockey Stick Graph • MBH used data from 1400-1980, 581observations for each of the 70 proxy variables (tree ring data) • Each variable would typically be standardized by the following formula: • MBH used a ‘decentered’ standardization: • What is the mean and standard deviation of a ‘decentered’ variable? • How will this impact principal component analysis?
Simulation Study of the Hockey Stick Graph Questions 1and 2: Generate a matrix of random AR(1) data. AR(1) data follows the general pattern of tree ring growth in many trees. Question 3: Standardize the data matrix Question 4: Perform PCA on a random AR(1) matrix with 70 series. Question 5: Write a function that repeats question 4 ten times. Question 6: Write a function that repeats question 5, but uses a ‘decentered’ standardization. Does it look like ‘hockey stick’ shaped graphs occur more often with decentered data? Can we conduct a more thorough simulation study?
The Hockey Stick Graph • Why do you think that the IPCC and supporters of the Kyoto accord prominently featured Mann’s (i.e. MBH’s) graph? • This paper shows reasons to believe that MBH’s graph was developed inappropriately; does this mean that there is no global warming? • State specifically how you would expect proponents and opponents to respond to MM’s and MBH’s work for their own political/personal benefit? • In 2006, the Chairman of the Committee on Energy and Commerce as well as the Chairman of the Subcommittee on Oversight and Investigations requested an Ad Hoc committee, chaired by Edward Wegman, to review the controversy between MM and MBH. This committee claimed there was improper use of principle component analysis in MBH’s work. Wegman’s report hasn’t been widely publicized. In addition, according to Wegman[i], he has been personally slandered and called a patsy for the Republican Party – even though he has stated publicly that he voted for Al Gore in 2000. Why do you believe this material hasn’t been made more public? Should inaccurate mathematical details remain hidden if it results in creating a better environment? • Other scientists have essentially stated that while Mann’s statistical analysis was incorrect; Mann’s conclusion (global warming) is correct and the focus should be on global warming and not the technical details[ii]. Do you agree with this assessment? • Wegman’s report and MM [http://www.climatechangeissues.com/files/PDF/conf05mckitrick.pdf p. 8] describe the difficulty of obtaining the original data (and algorithm) from MBH and Nature (where MBH’s article was published). Under a court subpoena, MBH has shared the raw data, however, to date, they have refused to share the code used in conducting Mann’s analysis and no one has been able to perfectly replicate his results. Do you feel that researchers and journals should be required to share data after an article has been published? Does your opinion change if the data collection was paid for by the US government? • Do you believe that research involving new/advanced statistical techniques should be reviewed by statisticians before it is published? • What can be done to ensure proper information is appropriately communicated to the public? What are the consequences of inaccurate data being highly publicized?
Proposed Course Week 1: Review of Statistics 101 Lab: Making connections between the two sample t-test, ANOVA, and regression Week 2-3: Randomization Tests/Nonparametric Tests Activity: Westvaco discrimination case Week 4-6: Multiple Regression Intro Lab: How much is your car worth? Lab: Population control and economic growth Week 7-9: Designing an Experiment Intro Lab: Weight gain in pigs Lab: Perfection- reaction time tests Week 10-12: Principal Component Analysis Intro Lab: Stock market values Lab: Global warming and the hockey stick graph Week 13 and 14: Final Projects