Download
1 / 2
20 likes | 143 Views
Tang et al. Hypercholesterolemia and ischemic PC. MS ID#CIRCULATIONAHA/2005/566190.

E N D
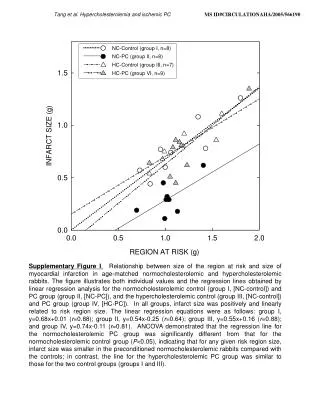
Tang et al. Hypercholesterolemia and ischemic PC MS ID#CIRCULATIONAHA/2005/566190 Supplementary Figure I. Relationship between size of the region at risk and size of myocardial infarction in age-matched normocholesterolemic and hypercholesterolemic rabbits. The figure illustrates both individual values and the regression lines obtained by linear regression analysis for the normocholesterolemic control (group I, [NC-control]) and PC group (group II, [NC-PC]), and the hypercholesterolemic control (group III, [NC-control]) and PC group (group IV, [HC-PC]). In all groups, infarct size was positively and linearly related to risk region size. The linear regression equations were as follows: group I, y=0.68x+0.01 (r=0.88); group II, y=0.54x-0.25 (r=0.64); group III, y=0.55x+0.16 (r=0.88); and group IV, y=0.74x-0.11 (r=0.81). ANCOVA demonstrated that the regression line for the normocholesterolemic PC group was significantly different from that for the normocholesterolemic control group (P<0.05), indicating that for any given risk region size, infarct size was smaller in the preconditioned normocholesterolemic rabbits compared with the controls; in contrast, the line for the hypercholesterolemic PC group was similar to those for the two control groups (groups I and III).
Tang et al. Hypercholesterolemia and ischemic PC MS ID#CIRCULATIONAHA/2005/566190 Supplementary Figure II. Relationship between size of the region at risk and size of myocardial infarction in normocholesterolemic rabbits with or without NAS treatment. The figure illustrates both individual values and the regression lines obtained by linear regression analysis for the control group (group VIII), the PC+vehicle group (group IX), the PC+NAS group (group X), the NAS group (group XI), and the NAS pretreatment group (group IV). In all groups, infarct size was positively and linearly related to risk region size. The linear regression equations were as follows: group VIII, y=0.58x+0.03 (r=0.88); group IX, y=0.37x-0.10 (r=0.74); group X, y=0.63x-0.09 (r=0.98), group XI, y=0.54x-0.04 (r=0.94); and group XII, y=0.51x-0.18 (r=0.80). ANCOVA demonstrated that the regression line for groups IX and XII was significantly different from that for group VIII (P<0.05), indicating that for any given risk region size, infarct size was smaller in the preconditioned rabbits that received vehicle or NAS before the PC ischemia compared with group VIII (the controls); in contrast, the line for group X was similar to that for group VIII.


![Koepke et al., [1997] Kaufman and Tanre [1997] Levy et al., [2004] Remer et al., [2006]](https://cdn2.slideserve.com/3945504/slide1-dt.jpg)