Download
1 / 26
260 likes | 402 Views
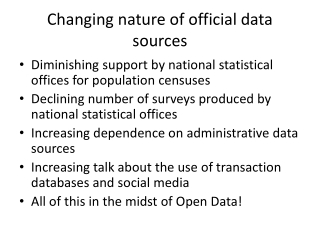
BIG D ata and OFFICIAL S tatistics. The Council of Professional Associations on Federal Statistics (COPAFS) Michael W. Horrigan Associate Commissioner Office of Prices and Living Conditions March 1, 2013. Big Data and Official Statistics. What are big data?

E N D
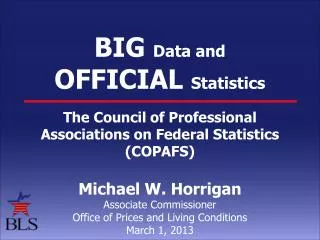
BIG Data and OFFICIAL Statistics The Council of Professional Associations on Federal Statistics (COPAFS) Michael W. Horrigan Associate Commissioner Office of Prices and Living Conditions March 1, 2013
Big Data and Official Statistics • What are big data? • How big data are already being used. • The future of using big data by statistical agencies – perspective from a quality framework.
Big Data and Official Statistics Non-sampled data Admin Data Sampled survey data Big Data
Bureau of Economic Analysis Non-sampled data Admin Data Sampled survey data Big Data GDP
How are Big Data being used? • Webscraping - Billion Prices Project • Webscraping – BLS CPI • Create data base of product characteristics for use in quality adjustment hedonic models • Televisions • Camcorders • Camera • Washing Machines • Research to expand use to collect prices for cable TV plans and airline prices
How are Big Data being used? • Google • Tools to create large data files that combine publicly available data on social and economic activity stratified by geography, and social-demographic characteristics • Flu outbreaks, social unrest, job search, unemployment, etc. • Modelling form combines google search index data in the current period with past values of an economic measure from the statistical system to predict a future value of the same concept.
How are Big Data being used? • Tweets University of Michigan Study database • Case study of job loss related tweets that examines the correlation with unemployment data to predict initial claims • Intuit • Time series of employment, compensation, hours worked, hourly rates of pay, % full time, new hire rate • Stratified by size, industries • ADP Payroll • Over the month change in payroll employment
How are Big Data being used? • Scanner data: Homescan, Nielson • Actual sales transactions • Comparison of national distribution of selected products with results from CPI disaggregation process • JD Power • Used car frame for CPI • Researching use for CPI production of new car price indexes
How are Big Data being used? • Medicare part B • PPI and CPI use reimbursements to doctors by procedure code in indexes • Claims data • Validation of MEPS and CPI inflation rates • Note: CPI constructs experimental disease based price indexes using annual weights from the MEPS household survey data
How are Big Data being used? • Stock Exchange Security Trades • PPI receives a monthly census of all bid and ask prices and trading volume for all traded securities as of market close for 3 selected days of the month. • These data are used for index estimation
How are Big Data being used? • Company provided data – Corp X • Research by CPI to use company provided data on all register transactions for sampled outlets • Challenges: • Can the matched model requirement be satisfied • Accounting for substitutes • IT production requirements • Risk of losing access
How are Big Data being used? Administrative data Published data using universe counts Sampled surveys Drawing samples Frame refinement Development of weights Imputation Estimation
How are Big Data being used? • BLS Quarterly Census of Employment and Wages: Some examples of uses: • BLS sampling: PPI, NCS, CES, OES, OSH, JOLTS, Green Jobs • Imputation: State based estimates use QCEW data to impute for key non-respondents • Use of QCEW data to develop forecasts that are used in the CES birth death model • Census of establishments by industry • Census of the Population • Customs Bureau trade flow data
How are Big Data being used? Administrative data Used directly in estimation • IPP uses EIA data on crude petroleum for their import indexes • PPI uses Department of Transportation data on baggage fees • CPI uses SABRE data for airline prices
How are Big Data being used? Administrative data Linking • Census Bureau’s Longitudinal Establishment…. • BLS Business Employment Dynamics • Linking within agencies • Sharing across agencies: CIPSEA
Assessing Big Data through the lens of Quality frameworks • Statistical agencies use a variety of quality dimensions to judge the efficacy of their direct data collection programs. • It is reasonable to ask how the use of Big Data by Billion Prices, Google, Intuit and others fare along the same dimensions • The use of external data sets (Big, Administrative, Other surveys) by statistical agencies to produce ‘blended’ estimates should come under the same scrutiny
Product Quality • Timeliness The two primary quality features of Billion, Google, Intuit • Relevance • Objectivity • Clear, unbiased • Accuracy – sampling errors • Calculated, published, used in analysis
Product Quality • Accuracy – non sampling errors • Coverage • Primary challenge to statistical systems • Often an advantage of Big Data • Non response bias • Significant concern of statistical systems about their own data and for Big Data • Classification/specification • Lack of cross walks across different classification systems across statistical systems, administrative data, firm data, big data
Product Quality • Timeliness • Relevance • Objectivity • Integrity • Accuracy – sampling and non-sampling errors Variances Coverage Standard Errors Nonresponse bias Specification errors Data processing errors Measurement error
Product Quality • Timeliness • Relevance • Objectivity • Integrity • Accuracy – sampling and non-sampling errors Variances Coverage Standard Errors Nonresponse bias Specification errors Data processing errors Measurement error
Product Quality • Metadata/transparency/interpretability • Coherence / comparability • Accessibility • Serviceability
The Future of Using Big Data by the U.S. Statistical System • Here to stay but quality assessment is lacking • Groves, Washington Post, August 7, 2012 • Costs and declining budgets make using big data in constructing blended estimates a reality • Assumes time more valuable than privacy, respondents willing to give permission to access bank records, credit card reports, taxes, etc.
The Future of Using Big Data by the U.S. Statistical System • Will households cooperate? • Asking respondent permission is key • Concerned about impact on both response rates and non-respondent bias. • More likely greater progress will be made using big data from businesses than households • What about integrating private sources of data such as Google, Intuit and Billion Prices? • Without transparency, not likely • Comparability more likely
Michael HorriganAssociate CommissionerOffice of Prices and Living Conditionswww.bls.gov202-691-6960horrigan.michael@bls.gov
![d ata[0]](https://cdn1.slideserve.com/3300577/slide1-dt.jpg)