Download
1 / 58
580 likes | 725 Views
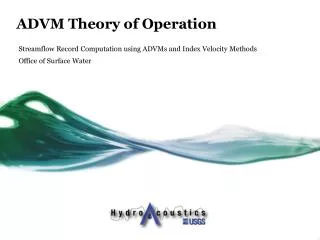
ADVM Site-Specific Programming. Streamflow Record Computation using ADVMs and Index Velocity Methods Office of Surface Water. Overview. Terminology. Terminology. Terminology. Measurement Volume and Multi-cell. Measurement Volume. Governed by: Velocity distribution

E N D
ADVM Site-Specific Programming Streamflow Record Computation using ADVMs and Index Velocity Methods Office of Surface Water
Measurement Volume • Governed by: • Velocity distribution • Obstructions and boundaries • Wake or flow disturbance • Amount of “scatterers” in water • Aspect ratio
Two Cell Sizes to Set • If activate multi-cell profiling, 2 separate measurements: • Overall, range-averaged cell • Multi-cell • Multi-cell data does not necessarily have to cover the same measurement volume as the range averaged cell
Step 3: Select Volume • Cell Begin • Cell End • Blanking Distance - should be the same as cell begin • Cell Size • Number of Cells
Flow Step 3a: Cell Begin/Blank Wake Turbulence: b = c(dx)0.5 b - lateral distance from pier centerline to edge of wake zone d - pier width x - distance to upstream face of pier c - factor for pier shape 0.62 – round-nosed 0.81 – rectangular-nosed x d b ADVM
Step 3a: Cell Begin • Review multi-cell data (once collected) to verify that the measurement volume is measuring in a region of undisturbed velocity • Cell Begin:
Step 3b: Cell End Cell End Marker Cell Begin Marker Theoretical Decay Curve Instrument Noise Floor Marker
Step 3b: Cell End • Avoid boundaries and obstructions • Want beam amplitudes at least 10-20 counts above noise level • Distance from a boundary is the greater of: • 10% of the range • Criteria based on ADVM frequency (SonTek):
Steb 3b: Cell End – Aspect Ratio Guidelines • Aspect ratio (AR) = R/D, where • R = range; end of the measurement volume • D = distance to nearest boundary (surface, bottom, obstruction) • Determines how far out you should profile to avoid beams or sidelobes glancing off water surface or streambed • Maximum AR of 15-20 is recommended! • Assumes sidelooker is installed perfectly level • Under certain conditions it is possible to accurately measure at distances corresponding to AR > 20 • Must also avoid any other obstructions!
Aspect Ratio • If max AR is 20, what is the max range we should measure? • Range = 20 * 3 ft = 60 ft • If the water level drops to 1 ft above the ADVM, what is the maximum range we should measure? • Range = 20 * 1 ft = 20 ft Sidelobe 4 ft 3 ft Sidelobe Measurement Range
Step 3b: Cell End • Also review multicell data (once collected) to verify that measurement volume is measuring a region of undisturbed velocity • Cell end:
Step 3c: Multi-cell • Blanking distance (same as cell begin) • Number of cells • Cell size must be divided equally If measurement volume = 10 m Cell size = 10 m/10 cells = 1 m
Example 500 kHz ADVM to be mounted on left bank
Example, cont. Follows decay curve fairly well Obstruction at ~ 65 m > 10-20 counts?
Example, cont. Flow • Rock upstream of mount near ADVM • Could cause undesirable turbulence near cell begin Rock
Example, cont. • Cell begin and blank: Wake turbulence due to rock • Computed minimum Cell Beginusing: • b = c(dx)0.5, where • c, shape factor = 0.62 (round rock) • d, width of rock = 2 m • x, distance from ADVM to upstream face of rock = 2.2 m • Min Cell Begin: b = 0.62(2 * 2.2)0.5; b = 1.3 m • Rounded up to 2 m to be conservative
Example, cont. (Cell begin & blank) • Obstruction at 65 m • Pick larger of: • 10% * range to obstruction = 6.5 m • 1.0 m (for 500kHz) • 6.5 m • Max cell end = 65 m – 6.5 m = 58.5 m
Example, cont. (Cell End) • Check aspect ratio limitation • Current cell end at 58.5 m • ADVM axis to surface = ~2m • ADVM axis to bed = ~2m • If Max AR is 20, is a cell end of 58.5 m ok? • Recompute: • AR=58.5/2=29.2 – Too High! • Re-arrange equation (AR = R/D) to calculate max cell end • R=AR*D = 20*2 = 40 m max Current Range = 58.5 m 2 m 2 m
Example, cont. (Cell End) • Are beam amplitudes >10-20 counts above noise at 40 m? • Yes • Need to check in range of conditions! >10-20 counts?
Example, cont. • Cell begin/blank = 2 m • Cell end = 40 m • Measurement volume = 40 – 2 = 38 m • Are we measuring in an appropriate velocity zone? • Yes, appears so • Multi-cell: • SonTek, so 10 cells max • Cell size = 38 m / 10 cells = 3.8 m each
Example, cont. Individual Cells: Blank = 2 m 10 cells at 3.8 m each 500 kHz ADVM Cell End = 40 m Cell Begin = 2 m Range-averaged Measurement Volume = 38 m
Changing Scatterers • Be careful! Amount of scattering material may change over seasons. Measurement volume may change.
Changing Scatterers, cont. • Cell End changes during a 2-month period
Measurement Volume for Uplookers • Range-averaged cell end is pulled back automatically • “Dynamic Boundary Adjustment” • However, multi-cell locations are fixed!
Dynamic Boundary Adjustment Example for SonTek XR Reprinted from SonTekweb site. www.sontek.com
SonTek SW and XR • Dynamic boundary adjustment – • Activated only in single depth-averaged cell!! • SW uses acoustic stage to set cell end • XR uses pressure sensor to set cell end • Multi-cell option has a fixed range or cell end – be careful! Near-surface cells can be corrupted/biased if water level falls below the last one or more cells
30 s 60 s Averaging Interval and Measurement Interval • Averaging Period or Interval (AI) The interval over which velocity measurements are collected, from which a mean velocity is reported • Measurement or Sampling Interval (SI) How often we record velocity (unit value interval) • The sampling interval can be set either in instrument or datalogger. In SDI-12 mode, the datalogger dictates the sampling interval!! S.I. A.I. = 15 sec S.I. = 30 sec A.I. ping 15 s Time
Averaging Interval - Unsteady Flow • SI = 15 min. • AI = 13.5 min. • ADVM is collecting data most of the time • Configuration is good for computing average flow, but extremes may not be measured well 48-minute period
Averaging Period • Smoothing the data for routine data collection • 1 min. to 10 min. averaging period
Averaging Interval – Advantages of Short AI • Reduced power consumption • Effect of a bias might be more evident than for long AIs. For example, if the ADVM beams hit a barge passing by or measure the wake of a ship • Short-term flow variations are captured
Averaging and Measurement Considerations • AI <= SI • Leave some buffer time for SDI-12; approximately 1 min. • Telemetry • Number of parameters transmitted may be limited
Averaging and Measurement Considerations • Will likely have 3 time periods with different sampling intervals and averaging intervals: • Initial exploratory measurements (when ADVM first installed) • Routine data collection (after exploratory period) • During discharge measurements (to improve synchronization of data)
Recommendations – Exploratory Period • Perhaps start with: • 5 minute (300 seconds) measurement interval • 4 minute (240 seconds) averaging period • Also measure stage every 5 minutes • This will give you 12 measurements per hour • Can adjust these if needed after reviewing data
Recommendations – Routine Data Collection • The sampling interval that correctly represents changes in flow over hydrograph is called the “Nyquist sampling rate” • Example: if streamflow changes from base flow to peak flow in 10 minutes, then we want a maximum sampling interval = 10/2 = 5 minutes • Maximum measurement interval = 15 minutes • Especially for tidal sites • Recommendations:
Recommendations – During Discharge Measurements • Change to 1-minute sampling intervals and averaging intervals during flow measurements • Velocity data • Stage data if practical • Allows for accurate synchronization with measurements • Make sure ADCP, ADVM, and DCP clocks are synced prior to the measurement!! Correct Time: www.time.gov http://tf.nist.gov/
Aliased Data – Class Question • Qm start = 13:00:00 • Qm end = 13:11:33 • Mid-time = 13:05:46 • If sampling interval was 15 minutes, what would be the index velocity (roughly)? • If sampling interval was 1 minute, what would be the index velocity? • The 15-minute index would be substantially less and could introduce error into rating!!
Salinity • Salinity is a measure of the dissolved salt content in water • Important because it affects density & speed of sound • Needs to be measured & configured in the ADVM • Most ADVMs allow entry of only 1 value • Change in salinity of 0 to 35 ppt results in 3% change in velocity • If salinity is significant and varies, enter the mid-point of the salinity range • Some sensors output conductivity, which is related to salinity. Online calculators at: • http://www.fivecreeks.org/monitor/sal.shtml and • http://www.chemiasoft.com/salinitycalc.html Courtesy YSI
Coordinate Systems • Typically set to XYZ or instrument to prevent compass errors from being introduced to data • If need earth coordinates (ENU), be sure to calibrate compass and remove all ferrous materials from mount and area!!
Stored and Transmitted Parameters • Recommended, parameters (in order): • X velocity • Water temperature • Cell End • Y velocity • Z velocity (if applicable) • Signal amplitude or SNR • Multi-cell data if needed • 5 cells max for SonTeks • 20 cells max for TRDIs Make sure internal ADVM record is on, too!
SonTek-Specific Programming • Unit System (Metric/English) • PowerPing (turn on if available) • Temperature (set to MEASURED) • ReverseXVelocity (for Sidelookers, if needed) • Deployment • Name of internal recorder file • Start date and time of measurements