Overview of Toxicogenomics Data Analysis: Microarray and Pathway Analysis Techniques
This presentation by Susan L.M. Coort, PhD, from Maastricht University, provides an in-depth overview of toxicogenomics data analysis, focusing on microarray data interpretation and pathway analysis. It covers essential topics such as quality control, normalization, statistical analysis with tools like Limma, and gene ontology analysis. The session emphasizes methods for annotating gene identifiers and analyzing over-represented pathways, offering valuable insights into biological interpretations and data visualization techniques to facilitate understanding of toxicogenomic research results.

Overview of Toxicogenomics Data Analysis: Microarray and Pathway Analysis Techniques
E N D
Presentation Transcript
PATHWAY ANALYSIS Susan LM Coort, PhD Department of Bioinformatics, Maastricht University susan.coort@maastrichtuniversity.nl PET course: Toxicogenomics
Data analysis overview Slide based on a slide from J. Pennings, RIVM, NL Microarray scans Image analysis Arrayanalysis.org Raw data Quality control Normalization Preprocessing NuGOexprFileCreator Normalized data Limma (GP) Statistical analysis ANOVA (AT) List of regulated genes Pattern analysis Gene ontology analysis Promoter analysis Textmining Pathway analysis Clustering (AT) GO-Elite oPOSSUM CoPub Untreated (control) Exposed to compound Results
Understanding microArray data • Typical procedure • Annotate the reporters with something useful (like Entrezgene) PET course: Toxicogenomics
Identifiers Identifier (id) for probe on microarray (example -> Cyp1A1): Platform specific id: Affymetrix id: 205749_at Agilent id: A_14_P106416 Illumina id: ILMN_4380 • General gene id: • Entrez Gene id: 1543 • Ensembl id: ENSG00000140465 • Refseq id: NM_000494 PET course: Toxicogenomics
Entrez Gene Identifier PET course: Toxicogenomics
Ensembl Identifier PET course: Toxicogenomics
Refseq identifier PET course: Toxicogenomics
Protein identifiers -> UniProt id PET course: Toxicogenomics
Find information on genes in databases on internet: NetAffx: search with Affymetrix id SOURCE: search with Entrez Gene id, Ensembl id (rat, mouse, human) DAVID: linking gene databases Annotation (I) PET course: Toxicogenomics
CYP PET course: Toxicogenomics
Understanding microArray data • Typical procedure • Annotate the reporters with something useful (like Entrezgene) • Sort based on fold change and p-value PET course: Toxicogenomics
Understanding microArray data • Typical procedure • Annotate the reporters with something useful (like Entrezgene) • Sort based on fold change and p-value • Search for your favorite genes/proteins • Throw away 95% of the array PET course: Toxicogenomics
Understanding microArray data • “Advanced” procedures • Gene clustering or principal component analysis • Get groups of genes with parallel expression patterns • Useful for diagnosis • Not adding much to understanding (unless combined) PET course: Toxicogenomics
Data analysis overview Slide based on a slide from J. Pennings, RIVM, NL Microarray scans Image analysis Raw data Quality control Normalization Preprocessing Normalized data Statistical analysis List of regulated genes Pattern analysis Gene ontology analysis Promoter analysis Textmining Pathway analysis Untreated (control) Exposed to compound Results
Why Pathway Analysis? • Intuitive to Biologists • Provide a biological context for results • More efficient than searching databases gene-by-gene • Intuitive data display for sharing data • Computation on Pathway Content • Analyze over-representation of changed genes on pathways and ontologies • Network analysis tools PET course: Toxicogenomics
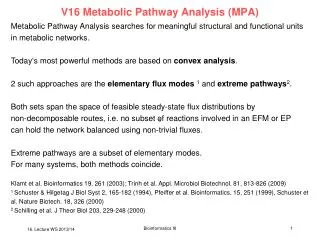
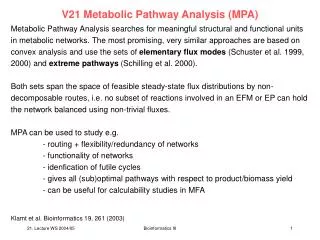
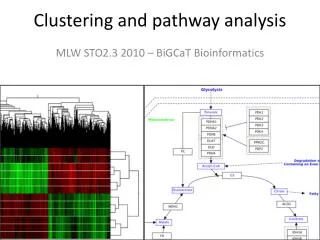
Pathway analysis From lists of differentially expressed genes to biological interpretation. Main Function: Find pathways that are overrepresented in regulated genes Visualize expression changes on pathways PET course: Toxicogenomics
Gene Ontology tools All freely available from internet • Based on Gene Ontology • Onto-Express • GOToolbox MAPPFinder (GenMAPP) • GO-Elite GOstat GeneMerge GOSurfer EASE Fatigo PET course: Toxicogenomics
GO consortium: www.geneontology.org PET course: Toxicogenomics
Gene Ontology (GO) levels (I) The Gene Ontology (GO) project gives a consistent description of gene products from different databases. PET course: Toxicogenomics
Gene Ontology (GO) levels (II) PET course: Toxicogenomics
Pathway analysis tools • Based on Gene Ontology • Onto-Express • GOToolbox MAPPFinder (GenMAPP) GOstat GeneMerge GOSurfer EASE Fatigo • Based on pathway maps • (KEGG, BioCarta, custom) • PathVisio • DAVID • Ingenuity MetaCore (GeneGO) PET course: Toxicogenomics
PathVisio www.pathvisio.org • Visualize gene expression on biological pathways • Identify significantly changed processes PET course: Toxicogenomics
Pathway Content • Contributed by research community • Created by GenMAPP group • Contributed by large-scale curation efforts • Converted between species • Distributed on WikiPathways PET course: Toxicogenomics
Identifiers in PathVisio Pathways Experimental Data • Affymetrix, Illumina, Agilent, CodeLink • Entrez Gene • RefSeq (protein only) • Unigene • UniProt • Ensembl • PDB • Entrez Gene • Unigene • UniProt • Ensembl PET course: Toxicogenomics
Gene Database Pathways Experimental Data Gene Database • Genes and annotation • Relational information • Assembled from Ensembl and GO PET course: Toxicogenomics
Supported Species Fruit fly Human Mouse Rat Worm Yeast Zebrafish PET course: Toxicogenomics
Visualize expression results Entrezgene PET course: Toxicogenomics
Example Pathway PET course: Toxicogenomics
Data mapped on Pathway PET course: Toxicogenomics
PathVisio Results: Z-score PET course: Toxicogenomics
Z-score Unchanged gene Changed gene Question: Does the small circle have a higher percentage of changed genes than the large circle? Is this difference significant? PET course: Toxicogenomics
Z-score The Z-score can be used as a measure for how much a subset of genes is different from the rest r = changed genes in Pathway n = total genes in Pathway R = changed genes N = total genes PET course: Toxicogenomics
PathVisio • Advantages: • Easy to use • Reasonable visualization • Some pathway statistics • Interesting content • Mapping of proteomics and metabolomics data • Disadvantages: • Small academic initiative, uncertain lifespan • No change (e.g. time course) visualization • Pathways are not complete (yet) PET course: Toxicogenomics
Sharing Pathways: WikiPathways www.WikiPathways.org • Wiki-technology for editing pathway content • PathVisio applet as pathway editor • Currently ~100 pathways (mouse, rat, human) • Pathway content is accessible to a wider audience • Community “peer review” • Pathway format is exchangeable • Facilitates pathway contribution PET course: Toxicogenomics
Online storage of microarray results PET course: Toxicogenomics
Online storage of microarray results • When publishing papers based on microarray data, one is encouraged (or even obliged) to store the data in online databases • Standards have been developed to describe microarray experiments and data • MIAME: Minimal Information About a Microarray Experiment (http://www.mged.org) • Two main databases exist: • Gene Expression Omnibus (GEO) at NCBI • ArrayExpress at EBI (European Bioinformatics Institute) PET course: Toxicogenomics