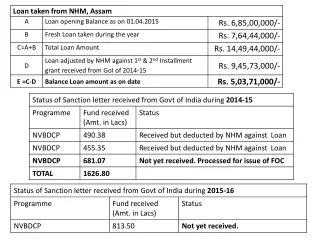
Download
1 / 96
960 likes | 1.02k Views
Explains population characteristics based on sampled data, aims to support research objectives and hypotheses, concludes statistical significance to make robust decisions. Steps in hypothesis testing and various tests like z, t, F, r for correlation analysis are outlined, along with examples to differentiate between null and research hypotheses. The importance of correlational analysis is highlighted for examining relationships between variables.

E N D
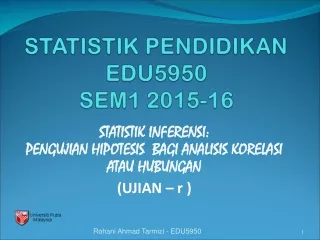
STATISTIK PENDIDIKANEDU5950SEM1 2015-16 STATISTIK INFERENSI:PENGUJIAN HIPOTESIS BAGI ANALISIS KORELASI ATAU HUBUNGAN (UJIAN – r ) Rohani Ahmad Tarmizi - EDU5950
STATISTIK INFERENSI ATAU PENTAKBIRAN (Inferential Statistics) • Bertujuan untuk menerangkan ciri populasi berdasarkan data yang dikumpul daripada sampel. • Tujuan ini berkait rapat dengan objektif kajian serta hipotesis atau soalan kajian. • Membolehkan penyelidik membuat kesimpulan bahawa terdapat “statistik yang signifikan” atau “statistical significance” yang bermaksud boleh diterima pakai dengan meluas, meyakinkan.
LANGKAH PENGUJIAN HIPOTESIS • L1. Nyatakan hipotesis hipotesis statistik/sifar (H0) dan hipotesis penyelidikan (HA) – BERARAH ATAU TIDAK BERARAH • L2. Tetapkan aras signifikan, taburan persampelan dan statistik pengujian yang akan digunakan – ARAS ALPHA = 0.01/ 0.05/ 0.10, TABURAN PERSAMPELAN z, t, F, r… STATISTIK PENGUJIAN (z, t, F, r…) • L3. Tentukan nilai kritikal bagi taburan persampelan yang akan digunakan - RUJUK JADUAL z, t, F, r… • L4. Kirakan statistik pengujian (tests statistics) bagi taburan persampelan tersebut – RUJUK FORMULA • L5. Buat keputusan, tafsiran, dan kesimpulan.
L1. Nyatakanhipotesis • Hipotesis penyelidikan – Terdapat perbezaan yang signifikan antara min tahap kepimpinan pengajaran Pengetua di Sekolah berprestasi tinggi berbanding dengan sekolah Swasta . • Hipotesis nol/sifar – Tiada terdapat perbezaan yang signifikan antara min tahap kepimpinan pengajaran Pengetua di sekolah berprestasi tinggi berbanding dengan sekolah Swasta.
1. Nyata hipotesis nol dan penyelidikan. HO : µ1 = µ2 HA : µ1 ≠ µ2 HO : µ1 ≥ µ2 HA : µ1 < µ2 HO : µ1 ≤ µ2 HA : µ1 > µ2
L1. Nyatakan hipotesis (lebih drpd dua kumpulan) • Hipotesis penyelidikan – Terdapat perbezaan yang signifikan antara tahap kepimpinan pengajaran Pengetua, GPK2 dan GPK1. • Hipotesis nol/sifar – Tiada terdapat perbezaan yang signifikan antara tahap kepimpinan pengajaran Pengetua, GPK2 dan GPK1.
ANOVA’S Hypothesis H0: 1 = 2 = 3 = ... = c • All population means are equal • No treatment effect (NO variation in means among groups) H1: not all the kare equal • At least ONE population mean is different • (Others may be the same!) • There is treatment effect • Does NOT mean that all the means are different:12 ... c
UJIAN PERBANDINGAN MIN • Ujian-t bebas (independent sample t-test) • diguna untuk menguji hipotesis bahawa tiada/ada perbezaan min kemahiran IT antara kumpulan lelaki dan perempuan. • Ujian-t bersandar (paired sample t-test) • digunakan untuk menguji hipotesis bahawa tiada/ada perbezaan min tahap kepemimpinan mengarah dengan min tahap kepemimpinan partisipatif. • Ujian analisis varians (analysis of variance, F test) • digunakan untuk menguji hipotesis tiada/ada perbezaan min kepuasan bekerja antara kumpulan yang berbeza taraf pekerjaan.
UJIAN PERBANDINGAN MIN-MIN • Terdapat perbezaan min antara dua kumpulan yang dikaji (hipotesis penyelidikan) • Tiada terdapat perbezaan min antara kumpulan yang dikaji (hipotesis sifar atau statistik). • Disini yang dibanding adalah min ia itu skor pembolehubah bersandar daripada dua atau lebih daripada dua kumpulan yang dikaji.
Ujidirianda!!!-Apakahpengujianstatistik yang diperlukan, JIKA ANDA HENDAK? • 1: Mengkajisamaadaterdapatperkaitan min kecekapanmenjalankanpenyelidikandengan min pengetahuanstatistikdikalanganpelajar Masters. • 2: Menentukansamaadaterdapathubunganantaratahappenglihatan “left field” dengan “right field” dikalanganpelajar. • 3: Mengujiterdapathubunganantarakemahiranberkomunikasidengantahapkeyakinan-diridikalanganpelajar FPP. • 4: Mengujiterdapathubungankemahiran IT antaraabangdanadik. • 5. Mengenalpastihubungankecerdasanintelekdengankecerdasanemosi
BAGI TUJUAN SEDEMIKIAN!! ANDA PERLUKAN ANALISIS KORELASI ATAU HUBUNGAN
ANALISIS KORELASI(Correlation Analysis) • Analisis ini membolehkan penyelidik menguji hipotesis bahawa terdapat • hubungan (relationship), • korelasi (correlation) atau • perkaitan (association) antara dua atau lebih pembolehubah • Analisis ini bertujuan untuk menentukan hubungan/korelasi antara pembolehubah- pembolehubah yang dikaji yang diperoleh/diukur daripada responden kajian iaitu kumpulan sampel ataupun populasi.
Analisisinidigunakanuntukmenjawabpersoalankajiansepertiberikut: • Adakahterdapathubunganantaraduapembolehubahtersebut? • “Is there relationship between the two variables?” • Sejauhmanakahhubungantersebut? • “How strong is the relationship?” • Apakaharahhubungantersebut? • “What is the direction of the relationship?”
ANALISIS KORELASI • Analisis korelasi juga boleh dilanjutkan menjadi beberapa pembolehubah – MULTICORELATIONAL ANALYSIS • Ia mengukur sejauh manakah dua atau lebih pembolehubah berubah (covary) secara serentak ataupun bersama-sama. • It is a measure of how variables covary together, hence the word CORRELATION
ANALISIS KORELASI • Analisis juga membabitkan dua kategori pembolehubah iaitu pembolehubah prediktif dan pembolehubah kriterion. • P/U prediktif adalah yang memberi kesan atau mempengaruhi P/U yang kedua. • P/U kriterion adalah yang menerima kesan atau pengaruh daripada P/U pertama. • X (prediktif) Y (kriterion) • X1, X2, X3,.. Y (kriterion) • Walau bagaimanapun, analisis ini hanya memeri gambaran hubungan dan tidak memberi rumusan “cause-and-effect relationship”.
Sebagai contoh, penyelidik hendak menentukan hubungan antara: • minat terhadap bidang dengan prestasi, • pendapatan dan kepuasan bekerja • kadar baja dan pertumbuhan pokok • frekuensi merokok dengan frekuensi mendapat serangan jantung • Umur dengan kadar ingatan • jam mentelaah, amalan pemakanan, IQ dengan prestasi.
Other Examples of Correlation Analysis • A researcher interested in the relationship between measures of depression and violence among fathers. • Relationship between age in years and performance in motor skills. • Relationship between hours of leisure and performance in course.
Temperature (F) Water Consumption (ounces) 75 16 83 20 85 25 85 27 92 32 97 48 99 48 Specific Example For seven random summer days, a person recorded the temperature and their water consumption, during a three-hour period spent outside.
Correlation A relationship between two variables. Response (Dependent) Variable Explanatory (Independent) Variable x y Hours of Training Number of Accidents Shoe Size Height Cigarettes smoked per day Lung Capacity Grade Point Average Score on MUET Height IQ What type of relationship exists between the two variables and is the correlation significant?
Dua Cara Menentukan Korelasi • Secara bergambar iaitu dinamakan gambarajah sebaran (scatter diagram) yang menunjukkan pola kedudukan pasangan titik-titik. • Daripada gambarajah sebaran kita dapat merumus keteguhan (magnitud) korelasi tersebut serta arah korelasinya.
Dua Cara Menentukan Korelasi • Secara berangka iaitu dengan menentukan pekali, koefisi atau indeks. • Daripada pekali tersebut kita dapat mengetahui keteguhan (magnitud) korelasi tersebut serta arahnya sama positif atau negatif.
MEMBINA GAMBAR RAJAH SEBARAN • Lakarkan dua paksi mengufuk dan mencancang • Letakkan p/u X (IV or predictive) pada paksi mengufuk dan tandakan paksi tersebut • Letakkan p/u Y (DV or criterion) pada paksi mencancang. • Plotkan titik-kedudukan bagi setiap pasangan skor di lakaran tersebut ia itu titik persilangan titik bagi X dan titik bagi Y bagi setiap pasangan skor.
Pola Kedudukan Titik Serta Garis Lurus Yang Terbentuk Menggambarkan Korelasi Atau Hubungan Iaitu: • titik-titik yang terletak di atas garis lurus yang mendongak menunjukkan korelasi sempurna dan positif. • titik-titik yang terletak di atas garis lurus yang menunduk menunjukkan korelasi sempurna dan negatif. • titik-titik yang bersepah tanpa pola garis lurus menunjukkan tiada korelasi.
Pola Kedudukan Titik Serta Garis Lurus Yang Terbentuk Menggambarkan Korelasi Atau Hubungan Iaitu: • titik-titik yang menghampir dengan garis lurus yang mendongak menunjukkan korelasi teguh dan positif. • titik-titik yang berjauhan daripada garis lurus serta juga mendongak menunjukkan korelasi lemah dan positif.
PolaKedudukanTitik Serta GarisLurus Yang TerbentukMenggambarkanKorelasiAtauHubunganIaitu: • titik-titik yang menghampiridengangarislurus yang menundukmenunjukkankorelasiteguhdannegatif. • titik-titik yang berjauhandaripadagarislurus yang jugamenundukmenunjukkankorelasilemahdannegatif.
Scatter Plots and Types of Correlation x = SAT score y = GPA GPA Positive Correlation as x increases y increases
Scatter Plots and Types of Correlation Accidents x = hours of training y = number of accidents Negative Correlation as x increases, y decreases
x Final Grade 95 90 85 80 75 70 65 60 55 50 45 40 0 2 4 6 8 10 12 14 16 x Absences Grade x y 8 78 2 92 5 90 12 58 15 43 9 74 6 81 Absences
Scatter Plots and Types of Correlation x = height y = IQ IQ No linear correlation
Hours of Internet use per week Depression scores from 15-45 50 - 40 + M 30 20 - 10 M 5 10 15 20 Hours of Internet Use X=I.V. Displays of scores in a Scatterplot Depression scores Y=D.V. +
C. No Correlation (r=.00) Association Between Two Scores Linear and non-linear patterns B. Negative Linear (r=-.68) A. Positive Linear (r=+.75)
D. Curvilinear Linear and non-linear patterns E. Curvilinear F. Curvilinear
Analisis Korelasi Menunjukkan 3 perkara penting, iaitu: • Arah/Direction (positive or negative) • Bentuk/Form (linear or non-linear) • Kekuatan/Magnitude (size of coefficient)
PEKALI ATAU KOEFISI KORELASI • TERDAPAT BEBERAPA JENIS PEKALI KORELASI IAITU: • Pearson product-moment correlation • Digunakan apabila p/u x dan y adalah pada skala sela atau nisbah atau gabungan kedua-duanya. • Spearman rho correlation • Digunakan apabila p/u x dan y adalah pada skala ordinal atau gabungan ordinal dengan sela/nisbah. • Point-biserial correlation • Digunakan apabila p/u x adalah dikotomus dan p/u y adalah pada skala sela atau nisbah.
Pekali Pearson r = n [ x y ] - [ x y ] [ n x2 - ( x) 2 ] [ n y2 - ( y)2 ] n = bilangan pasangan skor x y = jumlah skor x didarab dengan skor y x = jumlah skor x y = jumlah skor y
PekaliSpearman r = 1 - [ 6 B 2 ] n [ n2 - 1 ] n = bilangan pasangan skor B = jumlah beza pasangan setiap skor
Pekali Point-biserial r = y1 – y2[ n1 n2 ] sy n [ n - 1 ]
Interpreting Value of the Correlation Coefficient • The coefficient vary from zero to one. • Zero means there is simply no correlation between the two variables. • One means a perfect correlation. • Values approaching one is considered highly correlated. • Values approaching zero is least correlated. • A middle score indicates moderate or average correlation.
Interpreting Positive Correlation • A correlation can either be positively or negatively correlated. • Positive correlation is indicated by a positive value is obtained. • This means that the two variables are varying from each other: as X increases Y will also increase. • Y being the criterion variables (dependent variables) and X the predictive variables (independent variables)
Non-linear associations statistics • Spearman rho (rs) - correlation coefficient for nonlinear ordinal data • Point-biserial - used to correlate continuous interval data with a dichotomous variable • Phi-coefficient - used to determine the degree of association when both variable measures are dichotomous
Association Between Two Scores Degree and strength of association • .20–.35: • When correlations range from .20 to .35, there is only a slight relationship • .35–.65: • When correlations are above .35, they are useful for limited prediction. • .66–.85: • When correlations fall into this range, good prediction can result from one variable to the other. Coefficients in this range would be considered very good. • .86 and above: • Correlations in this range are typically achieved for studies of construct validity or test-retest reliability.
Interpreting Value of the Correlation Coefficient • The coefficient vary from zero to one. • Zero means there is simply no correlation between the two variables. • One means a perfect correlation. • Values approaching one is considered highly correlated. • Values approaching zero is least correlated. • A middle score indicates moderate or average correlation.
Guildford Rule of Thumb r Strength of Relationship < 0.2 Negligible Relationship 0.2 – 0.4 Low Relationship 0.4 – 0.7 Moderate Relationship 0.7 – 0.9 High Relationship > 0.9 Very high Relationship
Other Strengths of Association- By Johnson and Nelson (1986)
TYPES OF CORRELATION • Pearson correlation coefficient. • Spearman’s rank correlation coefficient. • Point-biserial correlation coefficient.
L1. Nyatakan hipotesis • Hipotesis penyelidikan – Terdapat hubungan yang signifikan antara tahap kepimpinan pengajaran Pengetua dengan prestasi akademik sekolah di Sabah • Hipotesis nol/sifar – Tiada terdapat hubungan yang signifikan antara tahap kepimpinan pengajaran Pengetua dengan prestasi akademik sekolah di Sabah
L2. TETAPKAN ARAS ALPHA = 0.01/ 0.05/ 0.10, TABURAN PERSAMPELAN, STATISTIK PENGUJIAN • Nilai alpha ditetapkan oleh penyelidik. • Ia merupakan nilai penetapan bahawa penyelidik akan menerima sebarang ralat semasa membuat keputusan pengujian hipotesis tersebut. • Ralat yang sekecil-kecilnya ialah 0.01 (1%), 0.05 (5%) atau 0.10(10%). • Nilai ini juga dipanggil nilai signifikan, aras signifikan, atau aras alpha.