Download
1 / 9
90 likes | 333 Views
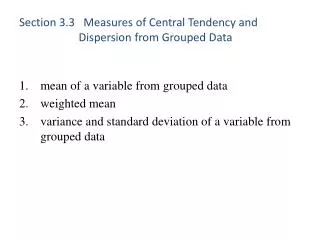
Section 3.3 Measures of Central Tendency and Dispersion from Grouped Data. mean of a variable from grouped data weighted mean variance and standard deviation of a variable from grouped data. 3- 1. 3- 2.

E N D
Section 3.3 Measures of Central Tendency and Dispersion from Grouped Data • mean of a variable from grouped data • weighted mean • variance and standard deviation of a variable from grouped data 3-1
EXAMPLE Approximating the Mean from a Relative Frequency Distribution The National Survey of Student Engagement is a survey that (among other things) asked first year students at liberal arts colleges how much time they spend preparing for class each week. The results from the 2007 survey are summarized below. Approximate the mean number of hours spent preparing for class each week. Source:http://nsse.iub.edu/NSSE_2007_Annual_Report/docs/withhold/NSSE_2007_Annual_Report.pdf 3-3
EXAMPLE Computed a Weighted Mean Bob goes the “Buy the Weigh” Nut store and creates his own bridge mix. He combines 1 pound of raisins, 2 pounds of chocolate covered peanuts, and 1.5 pounds of cashews. The raisins cost $1.25 per pound, the chocolate covered peanuts cost $3.25 per pound, and the cashews cost $5.40 per pound. What is the cost per pound of this mix. 3-6
EXAMPLE Approximating the Mean from a Relative Frequency Distribution The National Survey of Student Engagement is a survey that (among other things) asked first year students at liberal arts colleges how much time they spend preparing for class each week. The results from the 2007 survey are summarized below. Approximate the variance and standard deviation number of hours spent preparing for class each week. Source:http://nsse.iub.edu/NSSE_2007_Annual_Report/docs/withhold/NSSE_2007_Annual_Report.pdf 3-8