Download
1 / 8
490 likes | 2.43k Views
Measures of Central Tendency and Dispersion. ( Mean, Median, Mode and Range ) Pages 24 - 27. This is a method of calculating the average of a set of data The average represents the centre of the distribution

E N D
Measures of Central Tendency and Dispersion (Mean, Median, Mode and Range) Pages 24 - 27
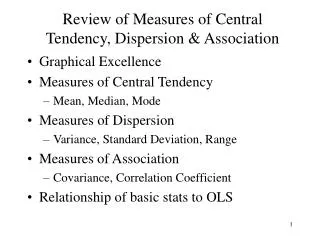
This is a method of calculating the average of a set of data The average represents the centre of the distribution These types of statistics are descriptive which means they seek to summarise the data The three common methods of finding the average are: The MEAN 2. The MEDIAN 3. The MODE Central Tendency
MEAN = sum of all values in the data set total no. of values in the data set Write out the formula for calculating the mean, see page 25. Workout the mean of the following data set. Depth of water in cm at intervals across a river channel: 45, 36, 36, 28, 24, 19, 16, 16, 12, 7, 3, 3, 3, 1. Advantages: All measures in data set are considered Simple to calculate Widely understood Most reliable when the data set is large with no abnormally extreme values Limitations: Influenced by extreme values in the data set Can yield a decimal figure – may be inappropriate e.g. 5.1 persons Less reliable the smaller the sample size Central Tendency - MEAN
Mean – Group Data • If data is collected in group form then the calculation for mean is a little different. • Data set for channel depth: • 45, 36, 36, 28, 24, 19, 16, 16, 12, 7, 3, 3, 3, 1. • To find the mean you take the midpoint of the group and multiply it by the frequency. • You then find the sum of the final column and divide it by the total number in the data set. n = E f x = Mean = E f x n Mean = ____
Mean – Grouped Data - Answers • If data is collected in group form then the calculation for mean is a little different. • To find the mean you take the midpoint of the group and multiply it by the frequency. • You then find the sum of the final column and divide it by the total number in the data set. n = 14 E f x = 223 Mean = E f x n Mean = 223 = 15.9cm 14
The median is the mid-point in a set of values when they are arranged in order of side. If there is an even number of values in a data set then you must calculate the average of the two central values when in numerical rank. Advantages: The extreme values do not distort your average Can be more reliable when there is ‘bunching, or clustering of values in the data set. Limitations: Mathematically less accurate as the actual values do not form part of a calculation Less reliable when the data set is small or when there are large gaps between the values. Calculate the median of the data set below. 45 36 36 28 24 19 16 16 12 7 3 3 3 1 What is the median group from the data table for channel depth? Central Tendency - MEDIAN Median = 7th + 8th value 2 Median = 16 + 16 2 Median = 16
This is the value which occurs most frequently in the data set. A data set may have no mode. If a data set has one peak it is called UNIMODAL, if it has two it is BIMODAL. Advantages: Describes the overall shape of the distribution e.g. unimodal or bimodal. Fast and easy as no calculations. Limitations: Limited mathematical value as modal value may represent extremes in the data set. Does not take into account the spread of values within the data set. Calculate the mode of the data set below. 45 36 36 28 24 19 16 16 12 7 3 3 3 1 What is the modal group from the data table for channel depth? Central Tendency - MODE Mode = 3 Why is this not a very good method of calculating central tendency in this particular set of data?
The MEAN summarises the ‘centre’ of a distribution, but on its own it may not be informative enough. It is often useful to show how far figures differ from the average. This measure is known as DISPERSION. Methods of showing dispersion: Range 2. The inter-quartile range Standard deviation In your exam you will only have to calculate the range. Range = the difference between the lowest and highest values in the data set. Calculate the range for channel depth in cm: 45, 36, 36, 28, 24, 19, 16, 16, 12, 7, 3, 3, 3, 1. Highest – lowest = range 45 - 1 = 44cm Advantages: Easy to calculate Shows the spread of data When used with the mean it shows the distribution of values around the mean – statistically more useful Limitations: Depends on only two values and ignores the rest. A particular problem if extreme values are atypical. The range tends to increase as the sample size increases. Dispersion