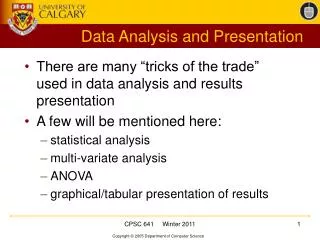
Data Analysis and Presentation
Data Analysis and Presentation. Describing and Presenting Data. Three important criteria—accuracy, conciseness, and understandability Researchers should always present their data in ways that most accurately represent the data

Data Analysis and Presentation
E N D
Presentation Transcript
Describing and Presenting Data • Three important criteria—accuracy, conciseness, and understandability • Researchers should always present their data in ways that most accurately represent the data • Numerical data can be classified as numerical (example: percentages, (means) or graphical (graphs) method)
Statistics • Three areas: 1) Descriptive – central tendency, dispersion measures 2) Relational – univariate, bivariate, or multivariate statistics 3) Inferential – difference of means, statistical significance tests
Measures of Central Tendency • The mean—average; most common and useful measure of central tendency; impacted by extreme scores • The median—middle score of a distribution; less affected by extreme scores (“outliers”) • The mode—most frequent score
Measures of Variability • Measures of Variability—descriptive statistics that convey information about the spread or variability of a set of data • Variance—a numerical index of the variability in a set of data • Standard deviation—a measure of variability that is equal to the square root of the variance • Range—the difference between the highest and lowest scores in a distribution
Relational Statistics • 1) univariate – study of one variable for a subpopulation (ex: age of murderers) • 2) bivariate – study of relationship between two variables (ex: correlation) • 3) multivariate – study of relationship between three or more variables (ex: multiple correlation)
Correlation • Measure of the strength of some relationship between two variables, but not causality. • Correlations can be positive, negative, or zero. • Strength of relationship depends on coefficient.
Inferential Tests • Refer to a variety of tests for inferential purposes. • 1. difference of means – to test hypotheses, most common is Z-test. • 2) statistical significance – most common are t-test and chi-square (used for less than interval data)
Frequency DistributionsA table that summarizes raw data by showing the number of scores that fall within each of the categories
Frequency Histograms and Polygons • Sometimes information in frequency distributions is more easily grasped when it is presented graphically • Histogram is used when horizontal (x-axis) variable is measured on an interval or ratio scale (bars on graph touch each other) • If data is nominal or ordinal, the bars do not touch each other and it is a bar graph