Download

1 / 53
570 likes | 793 Views
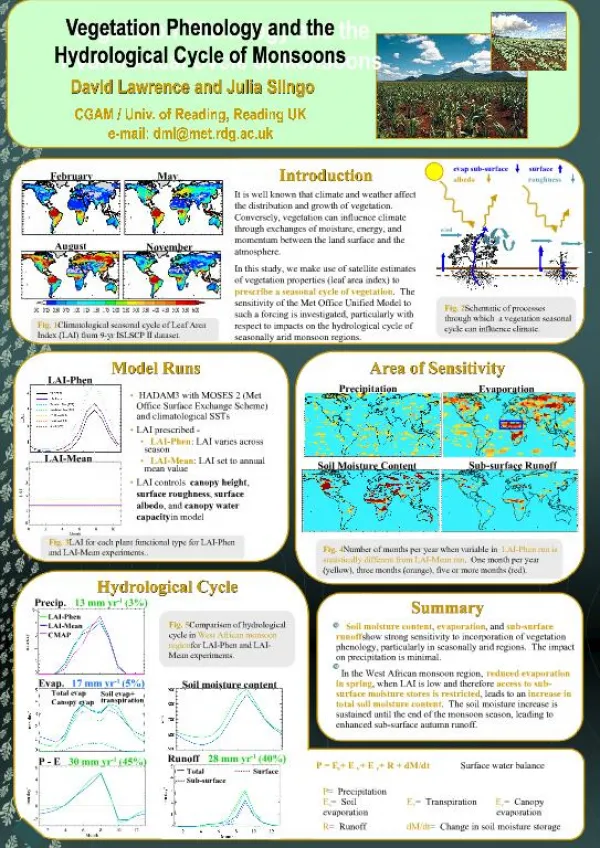
Seasonal Cycle, Monsoons and Tropical Convergence Zones. Vernon E. Kousky NOAA/ Climate Prediction Center February 2013. Global Seasonal Cycle: Prominent Features. Sea Surface Temperature (SST) Sea Level Pressure (SLP) Wind Precipitation Monsoons Southeast Asia South America Africa

E N D
Seasonal Cycle, Monsoons and Tropical Convergence Zones Vernon E. Kousky NOAA/ Climate Prediction Center February 2013
Global Seasonal Cycle: Prominent Features • Sea Surface Temperature (SST) • Sea Level Pressure (SLP) • Wind • Precipitation • Monsoons • Southeast Asia • South America • Africa • North America • Convergence Zones • Intertropical Convergence Zone (ITCZ), • South Pacific Convergence Zone (SPCZ), • South Atlantic Convergence Zone (SACZ), • Indian Ocean Convergence Zone (IOCZ)
SST: Major Features Atlantic Warm Pool Pacific Warm Pool Equatorial Cold Tongues
SST: Extremes in the Annual Cycle Equatorial SSTs are warmest in April Equatorial cold tongues are strongest in Jul.-Oct.
Sea Level Pressure • Largest annual cycle over the Northern Hemisphere • Southern Hemisphere displays weaker annual cycle
Annual Range in SLP (hPa) • Large annual range: • Mongolia/China • Aleutian Islands • Iceland • Southern Africa • Australia • South America
SLP: Major NH Features High pressure dominates continental areas (Asia, North America, Europe) during the NH winter, while low pressure is observed over the North Pacific (near the Aleutian Islands) and North Atlantic (near Iceland). H L H JAN L H H H Low pressure dominates continental areas (Asia and North America) during the NH summer, while high pressure is observed over the eastern North Pacific and central North Atlantic. L H H L JUL H H H
SLP: Major SH Features Low pressure dominates continental areas (Australia, South America, Africa) during the SH summer, while high pressure is observed over the subtropical and lower mid-latitude oceanic areas. H L H JAN L H H H High pressure dominates continental and oceanic regions in the subtropics and lower-mid-latitudes during the SH winter. L H H L JUL H H H
Upper-Tropospheric Wind • Jetstreams are strongest and closer to the equator during winter • Upper-level anticyclones develop in the subtropics near regions featuring intense convective precipitation • Mid-oceanic troughs develop at low latitudes in both hemispheres in regions of relatively cold SSTs
A A A A Upper-Tropospheric Wind & SST: January North Pacific jet stream located in region of strong meridional SST gradient Jet Oceanic troughs found in regions of weaker meridional SST gradient A
A A A Upper-Tropospheric Wind & SST: July South Pacific jet stream located in region of strong meridional SST gradient Oceanic troughs found in regions of weaker meridional SST gradient Jet
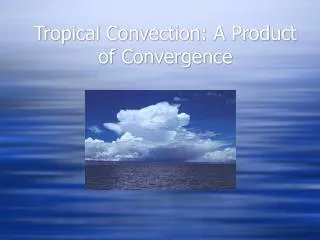
Precipitation • Global precipitation analyses based on station data and satellite-derived estimates • Greatest precipitation over warm surfaces where ample moisture is available, and in areas of mid-latitude storm activity • Tropical land masses • Intertropical Convergence Zones (ITCZs) • South Pacific Convergence Zone (SPCZ) • South Atlantic Convergence Zone (SACZ) • Mid-latitude winter storm tracks
Storm Tracks ITCZ IOCZ SPCZ SACZ Precipitation: Major Features
Precipitation: Major Features • Least precipitation in regions lacking moisture or featuring pronounced subsidence, and in colder regions • Equatorial cold tongues • Deserts • Subtropical high pressure systems • High latitudes
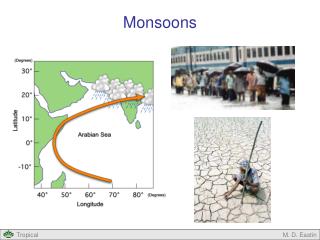
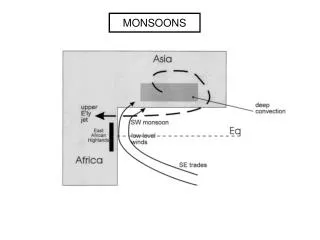
Monsoons • Seasonally varying winds • Typical monsoon regions include: • Southeast Asia • Indonesia/ Australia • South America • Central America/ North America • Africa
A OLR, 200-hPa Streamlines & 850-hPa Winds 22 July (1979-1995) Low-level winds flow from the southern Indian Ocean, northward along Somalia, and eastward across India to the Philippines. A NH upper-level ridge (A) at 30N extends from the Middle East westward to the western North Pacific. A SH upper-level ridge extends along 10S from the central South Pacific westward to the Indian Ocean. Low OLR, indicative of intense deep convection, covers India, Southeast Asia, southwestern China and the Philippines. High OLR, no deep convection, covers northern Australia and southern Indonesia. Thick black arrows indicate the direction of 200-hPa flow.
OLR, 200-hPa Streamlines & 850-hPa Winds 18 January (1979-1995) Low-level easterly winds are observed over the subtropical North Pacific westward to Somalia. Low-level westerly winds are found south of the equator from the Indian Ocean eastward across southern Malaysia and Indonesia. Upper-level ridges (A) are found over northern Australia and over the subtropical North Pacific. Low OLR, indicative of intense deep convection, covers Indonesia and extreme northern Australia. High OLR (no deep convection) covers India and Southeast Asia. A A Note: the low OLR over the higher latitudes indicates low surface temperatures, not the tops of deep convective clouds.
OLR, 200-hPa Streamlines & 850-hPa Winds 18 January (1979-1995) Low-level easterly winds are observed over the subtropical North Pacific westward to Somalia. Low-level westerly winds are found south of the equator from the Indian Ocean eastward across southern Malaysia and Indonesia. Upper-level ridges (A) are found over northern Australia and over the subtropical North Pacific. Low OLR, indicative of intense deep convection, covers Indonesia and extreme northern Australia. High OLR (no deep convection) covers India and Southeast Asia. A A Note: the low OLR over the higher latitudes indicates low surface temperatures, not the tops of deep convective clouds.
Meridional Circulation: January and July(Divergent circulation indicated by vectors; red (blue) shading indicates divergence (convergence) 20-30N Note the seasonal reversal in the direct circulation cell and in the pattern of convergence/ divergence. NH Winter: upper-level conv, low-level div, and subsidence NH Summer: upper-level div, low-level conv, rising motion
A OLR, 200-hPa Streamlines & 850-hPa Winds 8 January (1979-1995) Low-level winds flow from the equatorial Atlantic into the Amazon Basin and then flow south and southeast toward southeastern South America. An upper-level anticyclone (A) is found over Bolivia. Mid-oceanic troughs (heavy dashed lines) are found over the South Pacific and South Atlantic Oceans. (Heavy arrows indicate flow at 200 hPa.) Low OLR, indicative of intense deep convection, covers most of tropical South America. High OLR, no deep convection, covers Central America and the Caribbean Sea.
A OLR, 200-hPa Streamlines & 850-hPa Winds 12 July (1979-1995) Low-level winds flow from the equatorial Atlantic westward across South America and the equatorial Pacific. An upper-level anticyclone (A) is found over northern Mexico. Mid-oceanic troughs (heavy dashed lines) are found over the North Pacific and North Atlantic Oceans. (Heavy arrows indicate flow at 200 hPa.) Low OLR, indicative of intense deep convection, covers Central America and the southeast North Pacific Ocean. High OLR, no deep convection, covers Central South America.
A OLR, 200-hPa Streamlines & 850-hPa Winds 12 July (1979-1995) Low-level winds flow from the equatorial Atlantic westward across South America and the equatorial Pacific. An upper-level anticyclone (A) is found over northern Mexico. Mid-oceanic troughs (heavy dashed lines) are found over the North Pacific and North Atlantic Oceans. (Heavy arrows indicate flow at 200 hPa.) Low OLR, indicative of intense deep convection, covers Central America and the southeast North Pacific Ocean. High OLR, no deep convection, covers Central South America.
Meridional Circulation: January and July 10-20S SH Summer: upper-level div, low-level conv, rising motion South America SH Winter: upper-level conv, low-level div, and subsidence
A OLR, 200-hPa Streamlines & 850-hPa Winds 8 January (1979-1995) Low-level winds flow from the Arabian Sea into the Horn of Africa (Somalia). A weak upper-level anticyclone (A) is found over southern Africa. A mid-oceanic trough (heavy dashed line) is found over the South Atlantic. (Heavy arrows indicate flow at 200 hPa.) Low OLR, indicative of intense deep convection, covers Africa between the equator and 20S. High OLR, no deep convection, covers the Sahara Desert.
OLR, 200-hPa Streamlines & 850-hPa Winds 12 July (1979-1995) Low-level winds flow from the South Indian Ocean into eastern Africa (northern Mozambique, Tanzania, Kenya and Somalia). Upper-level ridges (heavy dashed lines) are found in the NH over northern Africa and the Middle East, and in the SH over the southern Indian Ocean and Africa between 5 and 10S. (Heavy arrows indicate flow at 200 hPa.) Low OLR, indicative of intense deep convection, covers Africa between the equator and 15N. High OLR, no deep convection, covers the Sahara Desert, the Middle East and southern Africa.
Vertical Wind Shear • Low vertical wind shear in the tropics, combined with warm (greater than ~27°C) SSTs, are necessary conditions for tropical storm development. • Regions of strong monsoons experience greatest tropical storm activity during the transition seasons, when weaker vertical shear is present.
Convergence Zones • Intertropical Convergence Zones (central and eastern Pacific Ocean, Atlantic Ocean, Indian Ocean, western Africa. • South Pacific Convergence Zone (SPCZ) • South Atlantic Convergence Zone (SACZ) • Baiu/ Mei-yu Front (East Asian Convergence Zone)
Storm Tracks ITCZ IOCZ SPCZ SACZ
Storm Tracks Baiu/Meiyu Front ITCZ Storm Tracks
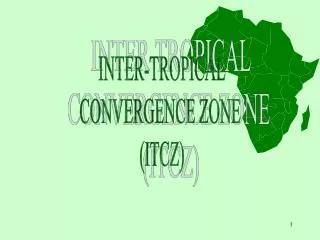
Intertropical Convergence Zones (ITCZs) • Regions of confluence/convergence, usually where the northeast trade winds of the Northern Hemisphere meet the southeast trade winds of the Southern Hemisphere
ITCZ ITCZ Pacific ITCZ The Intertropical Convergence Zone (ITCZ) is most distinct over the eastern Pacific, where the Northeast Trades and Southeast Trades converge between 5N and 10N and the sea surface temperatures are warm (see next slide).
ITCZ SPCZ ITCZ Warm Pool SPCZ SPCZ ITCZ Pacific SPCZ The South Pacific Convergence Zone occurs during the SH summer (December-March), and is located near a warm pool in the South Pacific Ocean. Southern Hemisphere cold fronts advancing northward over the South Pacific tend to stall in the region between 10S and 20S, contributing to low-level convergence, upward vertical motion and intense convection. 20N EQ 20S Precipitation (mm/d)