Download
1 / 31
320 likes | 515 Views
ENSO and Monsoons. October 27. http://www.pmel.noaa.gov/tao/elnino/nino-home.html. ENSO Indices http://ioc3.unesco.org/oopc/state_of_the_ocean/all/. Niño 3.4.

E N D
ENSO and Monsoons October 27
ENSO Indiceshttp://ioc3.unesco.org/oopc/state_of_the_ocean/all/
Niño 3.4 The Niño3.4 SST anomaly index is an indicator of central tropical Pacific El Niño conditions. It is calculated with SSTs in the box 170°W - 120°W, 5°S - 5°N.
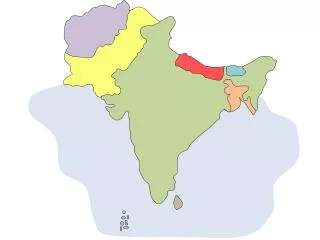
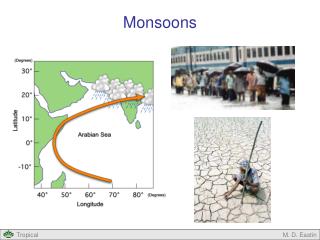
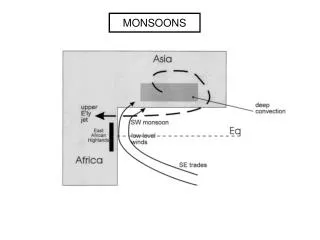
Indian Ocean is different from other basins • – bounded by Asian land mass to the north • - leads to seasonal monsoon climate • Indian peninsula densely populated • (see http://www.crseo.ucsb.edu/esrg/IOM2/Start2_IOM.html)
Differential heating/cooling of Tibet Plateau and Indian Ocean drives monsoon wind systems
From Schott and McCreary, 2001, Progress In OceanographyVolume 51, Issue 1 , Pages 1-123
From Schott and McCreary, 2001, Progress In OceanographyVolume 51, Issue 1 , Pages 1-123
Mean is Meaningless! From Schott and McCreary, 2001, Progress In OceanographyVolume 51, Issue 1 , Pages 1-123
Image of the MODIS/Terra sea surface temperature (SST) and SeaWinds vectors from the week beginning on April 22, 2004
Southwest (Summer) Monsoon Currents A schematic representation of identified current branches during the Southwest Monsoon, including some choke point transport numbers (Sv=106m3s−1). Current branches indicated are the South Equatorial Current (SEC), South Equatorial Countercurrent (SECC), Northeast and Southeast Madagascar Current (NEMC and SEMC), East African Coast Current (EACC), Somali Current (SC), Southern Gyre (SG) and Great Whirl (GW) and associated upwelling wedges, Socotra Eddy (SE), Ras al Hadd Jet (RHJ) and upwelling wedges off Oman, West Indian Coast Current (WICC), Laccadive High and Low (LH and LL), East Indian Coast Current (EICC), Southwest and Northeast Monsoon Current (SMC and NMC), South Java Current (JC) and Leeuwin Current (LC). From Schott and McCreary, 2001, Progress In OceanographyVolume 51, Issue 1 , Pages 1-123
Northeast (Winter) Monsoon Currents From Schott and McCreary, 2001, Progress In OceanographyVolume 51, Issue 1 , Pages 1-123
Mean velocity sections across Indian Ocean western boundary currents for a) Northeast Madagascar Current at Cape Amber (westward is positive); b) Southeast Madagascar Current at 23°S (southward is positive), both from Swallow et al. (1988); and c) Somali Current on the equator (northward is positive) during the summer monsoon (left), during the winter monsoon (middle) and annual mean (right; from Schott et al., 1990)
Near-Surface Circulation and Salinity in Somali Current showing Great Whirl, Southern Gyre, and Socotra Eddy (from IFM-Univ. Kiel - http://www.ifm.uni-kiel.de/fb/fb1/po1/research/woce/woce-io.html)
From Schott and McCreary, 2001, Progress In OceanographyVolume 51, Issue 1 , Pages 1-123
Chlorophyll from CZCS April 1979 Composite August 1979 Composite
Eastward Wyrtki Jets form along equator during Spring and Fall Monsoon Transitions Driven by W-E (westerly) winds in resonance with Equatorial Kelvin and Rossby Waves From Schott and McCreary, 2001, Progress In OceanographyVolume 51, Issue 1 , Pages 1-123
Indian Ocean Dipole Mode From TOPEX altimeter
The development of the Indian Ocean Dipole Mode according to Webster et al. (1999, their Fig. 4).
From Krishnan et al., GEOPHYSICAL RESEARCH LETTERS, VOL. 33, L08711, doi:10.1029/2006GL025811, 2006