Download
1 / 43
430 likes | 515 Views
Explore the definitions, dimensions, and key questions regarding food security, vulnerability, and coping strategies. Learn about food availability, access, utilization, stability, and indicators for understanding food security situations.

E N D
Regional Issues for Integrated Censuses and SurveysFood Security
Food Security Concepts • “Food security exists when all people, at all times, have physical and economic access to sufficent, safe and nutritious food that meets their dietary needs and food preferences for an active and healthy life” (World Food Summit, 1996)
Definitions • Hunger – lack of calories • Malnutrition – undernutrition, obesity and overweight, and micronutrient deficiency
Four Dimensions • Food availability • Food access • Utilization • Stability
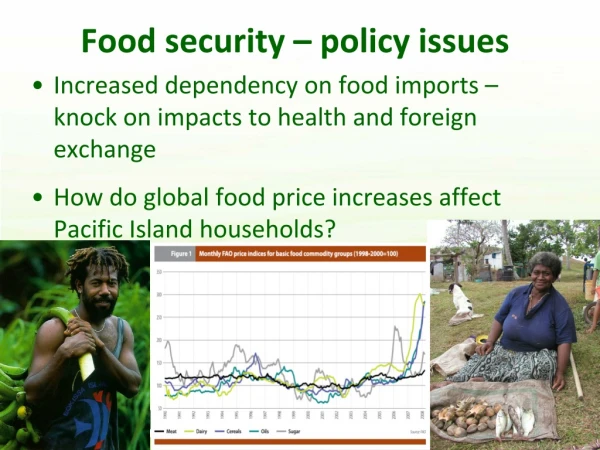
Food Availability • The availability of sufficient quantities of food of appropriate quality, supplied through domestic production or imports • Addresses “supply side” of food security • Determined by level of food production, processing by food industry stock levels and net trade. • Measured using Food Balance Sheets
Food Access • Access by individuals to adequate resources (entitlements) for acquiring appropriate foods for a nutritious diet • Entitlements: commodity bundles a person can access given the legal, political, economic and social arrangements of their community (including traditional rights such as access to common resources) • Defined by financial but also legal, political, and social rights and restrictions • Covers own consumption, commercial, public distribution schemes and food aid
Utilization • Utilization of food through adequate diet, clean water, sanitation and health care to reach a state of nutritional well-being where all physiological needs are met • Important non-food inputs in food security • Related to health, body’s uptake of food and nutrients etc
Stability • To be food secure, a population, household or individual must have access to adequate food at all times • Access to food stable under sudden shocks (e.g. an economic or climatic crisis) or cyclical events (e.g. seasonal food insecurity) • Refer to both availability and access dimensions
Key Questions for Analysis Food insecurity • Who are the nutrition insecure? • Who are the food insecure? • How many? • Where do they live? • What are the causes of their food and nutrition insecurity? Vulnerability • Who is vulnerable and where they are located? • What are the major risks they face? • What risk management strategies are used and how effective are they? COPING STRATEGIES Duration and Severity
Food Security Items FOOD INSECURITY SITUATION • Food Consumption module of HIES • Range of indicators • Proxy – dietary diversity • Proxy – perceptions of food sufficiency and security • Uncertainty or anxiety over food supply or food shortage • Perception of inadquate quality or quantity • Adults reducing food intake • children reducing food intake • Proxy – Number of meals per day
Food Security Items VULNERABILITY, • Diversity of income sources • No of different household income • No of different crops grown • Food self sufficiency • No of months of year with food shortage COPING STRATEGY, CAUSES, Reasons for food shortage • How the household’s eating patterns were affected by food shortage • Steps taken to alleviate food shortage • Frequency of normally eating selected food products • Effects of natural disasters • Extent of loss of agricultural output due to natural disasters
WCA 2010Coping strategy , Causes, Duration and Severity – Malawi HIES
Food Security Indicators to understand food security situation • Availability • Access • Utilization • Stability
Indicators from Household Consumption Surveys • Derived from the FAO Food Security Statistics Module (FSSM) • Software for development of the MDG indicator : prevalence of undernourished • Other indicators are a byproduct • Using food consumption data from household surveys • Needs additional nutrient conversion tables, food composition to calorie tables and household data – sex, age etc for each item
Levels of Indicators • Data Processing - Direct HIES, conversion to energy and nutrients • L1 Quantities and values of food for household consumption in relation to total expenditure • L2 Estimation of Dietary Energy Consumption – conversion of L1 quantities (or estimates of quantities) to kilocalories • Breakdown into DEC from protein, fat and carbohydrate and alcohol; unit costs and elasticity of energy • L3 Estimation of Essential Amino Acids – conversion of quantities to EAA (vitamins and minerals)
Indicators: Availability L1 • Average food consumption in monetary value (LC$/person/day) • Average total consumption expenditures (LC$/person/day) • Average total income (LC$/person/day) L2 • Average food consumption in dietary energy value (kcal/person/day) • Average dietary energy unit value (LC$/1000kcals)
Indicators: Availability (2) L1 • Share of food expenditures to total consumption expenditure (%) • Share of food expenditures from purchased to total food consumption expenditures (%) • Share of food expenditures from own production to total food consumption expenditures (%) • Share of expenditures of food eaten away from home to total food consumption expenditures (%) • Share of food expenditures from other sources to total food consumption expenditures (%)
Indicators: Availability (3) L2 • Share of food dietary energy from purchased to total food dietary energy consumption (%) • Share of food dietary energy consumption from own production to total food dietary energy consumption (%) • Share of food dietary energy consumption eaten away from home to total food dietary energy consumption (%) • Share of food dietary energy from other sources to total food dietary energy consumption (%)
Utilization: Quality of Diet L2 • Average food protein consumption (g/person/day) • Average food carbohydrates consumption (g/person/day) • Average food fat consumption (g/person/day) • Cost of 100g of proteins (LC$/100g) • Cost of 100g of carbohydrates (LC$/100g) • Cost of 100g of fats (LC$/100g) • Share of calories from proteins in total calories (%) • Share of calories from fats in total calories (%) • Share of calories from carbohydrates (incl. fiber) in total calories (%) • Share of animal protein in total protein consumption (%)
Food Access: Inequality of food Consumption L2 • CV of dietary energy consumption (%) • CV of food consumption expenditures (%) • GINI of Income (%) • GINI of dietary energy consumption (%) • Dispersion ratio of dietary energy consumption (80/20) • Dispersion ratio of food consumption expenditures (80/20) • Dispersion ratio of total consumption expenditures (80/20) • Dispersion ratio of income (80/20) • Income elasticity of dietary energy consumption (%) • Income elasticity of food consumption expenditures (%)
Designing a food consumption module suitable for food security • FAO, IHSN, World Bank project (HBS/HIES) • Assess suitability of HIES for food security data and indicators • Publically available surveys and data from WB and IHSN portal • No standard guidelines: inconsistent methodologies in countries, scope, coverage, frequency and timing • Lack of relevance and poor reliability of data • Poor comparability over time and across countries
Designing a food consumption module for food security (2) • HIES main objective: consumer price index basket of goods • Other objectives • Repurposed food fortification programs • Assessing food security and food diversity availability of macro and micronutrients • Purchasing power parities • Spatial price differences • CONSULTATION WITH STAKEHOLDERS: Balance with need for CPI
What to collect: Acquisition or Consumption Survey • Acquisition – food brought into the household over the time period • For own production reporting is on food actually consumed by household members not that harvested and not consumed • Consumption – food actually consumed by the household • Includes food from sources purchased, production and gifts • Consumption better indicator of food access • More difficult to collect: recall is more difficult • Requires trained enumerators, daily diaries, frequent visits from enumerators • But Food aqcuired is more often collected
Stocks • Food acquired during one period is not all consumed during the same period • For food acquired important to collect information on beginning stocks and ending stocks • Taking food acquired and including stock variation allows calculation of food consumed over the period
What to collect: Quantities or Expenditures • Ideally both food quantities and food expenditures should be collected • At least one is essential • Necessary for indicator per capita daily dietary consumption • Record unit of measurement and conversion factors • Needed for conversion of quantities to kilocalories • Expenditure – lowest cost and burden for respondent and enumerator • But needs converting to quantities • Requires estimation for conversion to quantities • Prices for conversion to quantities • Prices should be at sub national level • Prices should be available for all the food items included in the food consumption module e.g. average price of rice vs price of different varieties of rice • Prices should be from same survey period as HIES survey
What to collect: Quantities or Expenditures Enumeration Issues Quantities • Quantities harder to enumerate than expenditure • Requires more skilled enumerators and greater support to respondents Expenditures • Difficult to estimate expenditure when most food is from own production • Supplementary data on market prices is needed to convert to quantities
Unit of Measurement of Food quantities • Can be collected in local units or standard units • Collection of metric units rarely feasible • Local unit of measurement give better recall of quantities • Requires additional metric weight for conversion of each food in each unit of measure reported • Can be collected as part of the household survey • Local units may vary from village to village. May require collection for several areas
Food Sources • Purchase, own production, gifts, food eaten away from home • Allows assessment of sustainability of food security and vulnerability to shocks • Should collect for each food item • Own production – only record what was consumed during the recall period not total harvest
Foods Eaten Away From Home • Food away from home - difficult to estimate quantities and food items • Recommended: Respondents identify dishes consumed • Additional information from vendors on ingredients and prices • Simple method: total expenditure on food away from home • Calories of FEAH estimated by expenditure / price per calorie of food acquired for consumption at home • Problems with the simple method: • Food consumed outside not same as that eaten at home • Food outside more expensive due to preparation costs • Food outside has a wider variety of food groups than that at home
What to collect diary or food list • Diary or questionnaire • Diary: some similar issues • Consumption or acquisition; quantities or expenditure; units of measurement etc. • Diary can allow for detailed recording of items produced • Major issue for data quality – highly dependent on quality of enumeration • Diary requires a literate household member or frequent visits, • May not be complete for reference period • Requires supervision to ensure completion for entire reference period • May not be completed daily – compromises the advantages of a short recall period
What to collect: Food list • Should reflect the consumption pattern of the population • Short lists with only food groups tends to reduce quantities and expenditure reported • Also don’t allow clear attribution of kilocalories and macronutrient quantities • Length of list of food items balanced by respondent fatigue • Similar foods with different calorie contents should be listed as distinct items – enable conversion to calories • If collecting expenditures separate listing of different versions of the same food with different prices • Allows conversion to metric quantities • Separate food and non food items • Avoid residual categories which don’t allow food identification • All other foods etc.
Enumeration • Long recall period – difficulty in remembering food acquired • Downward bias to estimates • Short recall period – more reliable but biased by special events, telescoping, particular conditions • Usually 1-2 weeks • Some findings suggest 7 days similar results to diary • Usual food consumption – requires several visits over time, either panel or splitting the sample • Collection during “normal” period of the year