Download
1 / 22
220 likes | 354 Views
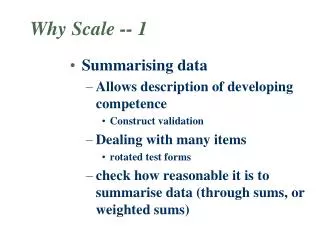
Why Scale -- 1. Summarising data Allows description of developing competence Construct validation D ealing with many items rotated test forms check how reasonable it is to summarise data (through sums, or weighted sums). What do we want to achieve in our measurement?.

E N D
Why Scale -- 1 • Summarising data • Allows description of developing competence • Construct validation • Dealing with many items • rotated test forms • check how reasonable it is to summarise data (through sums, or weighted sums)
What do we want to achieve in our measurement? Locate students on a line of developing proficiency that describe what they know and can do. ================================ So, we need to make sure that • Our measures are accurate (reliability); • Our measures are indeed tapping into the skills we set out to measure (validity); • Our measures are “invariant” even if different tests are used.
Properties of an Ideal Approach • Scores we obtained are meaningful. Cath Ann Bill • What can each of these students do? • Scores are independent of the sample of items used • If a different set of items are used, we will get the same results.
Using Raw Scores? • Can raw scores provide the properties of an ideal measurement? • Distances between differences in scores are not easily interpretable. • Difficult to link item scores to person scores.
Equating raw scores - 2 100% A A Score on the hard test C C B B B C A 100% 0 Score on the easy test
Link Raw Scores on Items and Persons Task Difficulties Object Scores word problems ? 25% 90% arithmetic with vulgar fractions ? 50% 70% multi-step arithmetic ? 70% 50% single digit addition ? 90% 25%
Item Response Theory (IRT) • Item response theory helps us address the shortcomings of raw scores • If item response data fit and IRT (Rasch) model, measurement is at its most powerful level. • Person abilities and item difficulties are calibrated on the same scale. • Meanings can be constructed to describe scores • Student scores are independent of the particular set of items in the test. • IRT provides tools to assess the extent to which good measurement properties are achieved.
IRT • IRT models give the probability of success of a person on items. • IRT models are not deterministic, but probablistic. • Given the item difficulty and person ability, one can compute the probability of success for each person on each item.
Building a Model Probability of Success 1.0 0.5 0.0 Very high achievement Very low achievement
Imagine a middle difficulty task Probability of Success 1.0 0.5 0.0 Very high achievement Very low achievement
Item Characteristic Curve Probability of Success 1.0 0.5 0.0 Very high achievement Very low achievement
Variation in item difficulty 3 1 2
3 | | | | X| | X| | XX| | 2 XX| |9 22 XXX| | XXX| |6 16 XXXXX| |8 11 27 29 1 XXXXX| | XXXXXXX|* |31 XXXXXXX|* |2 30 XXXXXXXXX|* * * |13 XXXXXXXXXX|* * * * * |19 0 XXXXXXX|* * * * * * |5 32 XXXXXXXX|* * * * * |7 15 28 XXXXXXX|* |4 14 21 XXXXXXXX|* * |3 17 20 23 XXXXXXXXX| |10 18 24 -1 XXXXXX| | XXXX|* |1 XXXX| | XX| |12 26 -2 XXX| |25 XX| | X| | X| | X| | -3 X| |
3 | | | | X| | X| | XX| | 2 XX| |9 22 XXX| | XXX| |6 16 XXXXX| |8 11 27 29 1 XXXXX| | XXXXXXX|* |31 XXXXXXX|* |2 30 XXXXXXXXX|* * * |13 XXXXXXXXXX|* * * * * |19 0 XXXXXXX|* * * * * * |5 32 XXXXXXXX|* * * * * |7 15 28 XXXXXXX|* |4 14 21 XXXXXXXX|* * |3 17 20 23 XXXXXXXXX| |10 18 24 -1 XXXXXX| | XXXX|* |1 XXXX| | XX| |12 26 -2 XXX| |25 XX| | X| | X| | X| | -3 X| | Tasks at level 5 require doing mathematics in an active way: finding suitable strategies, selecting information, posing problems, constructing explanations and so on. Tasks at level 3 require doing mathematics in a somewhat "passive way", such as manipulating expressions, carrying out computations, verifying propositions, etc, when the modelling has been done, the strategies given, the propositions stated, or the needed information is explicit. Tasks at level 1 require mainly recall of knowledge, with little interpretation or reasoning.
3 | | | | X| | X| | XX| | 2 XX| |9 22 XXX| | XXX| |6 16 XXXXX| |8 11 27 29 1 XXXXX| | XXXXXXX|* |31 XXXXXXX|* |2 30 XXXXXXXXX|* * * |13 XXXXXXXXXX|* * * * * |19 0 XXXXXXX|* * * * * * |5 32 XXXXXXXX|* * * * * |7 15 28 XXXXXXX|* |4 14 21 XXXXXXXX|* * |3 17 20 23 XXXXXXXXX| |10 18 24 -1 XXXXXX| | XXXX|* |1 XXXX| | XX| |12 26 -2 XXX| |25 XX| | X| | X| | X| | -3 X| | Why a Rasch Model? Distance between the location of items and students fully describe students’ chances of success on the item This property permits the use of described scales