Download
1 / 29
300 likes | 489 Views
Using Dasymetric Mapping to Develop a Population Grid for Hazard Risk Assessments. Ben Anderson Project Manager University of Louisville Center for Hazards Research and Policy Development Ben.anderson@louisville.edu. Presentation Outline. Census Data Aggregation Levels

E N D
Using Dasymetric Mapping to Develop a Population Grid for Hazard Risk Assessments Ben Anderson Project Manager University of Louisville Center for Hazards Research and Policy Development Ben.anderson@louisville.edu
Presentation Outline Census Data Aggregation Levels Problem Statement Dasymetric Mapping Population Grid
Objectives Introduction to Dasymetric Mapping Application of Dasymetric Mapping Underlying need for Standardizing Area Use in Risk Assessment
Census Data Aggregation Levels • Aggregation Levels • Country • State • County • Tract • Block Group • Block • Tracts, Block Groups, and Blocks are aggregation levels that are designed to be similar in population but not area.
Census Tracts Census Tracts are a statistical subdivision of a county Tracts are designed to have between 1,500 and 8,000 persons Tracts can change from Census to Census as the population changes. In Kentucky Counties have between 1 tract and 191 tracts in the 2010 Census
Census Block Groups • Census Block Groups are a statistical subdivision of Census Tracts • Block Groups are designed to have between 600 and 3,000 people with an optimum size of 1,500 • Block Groups can change from Census to Census • Block Groups are the smallest level which the Census bureau publishes sample data • As of the 2010 Census all data excluding population count, sex, age, race, or ownership status is sample data.
Census Blocks • Census Blocks are a statistical subdivision of Block Groups • Blocks in urban areas are often literally a city block, in rural areas blocks can be much larger • In KY Blocks range from 94.22 to less than .001 square kilometers. • Blocks are the smallest subdivision that the Census releases full count data on.
Comparing Risk • Center for Hazards Research has done Hazard Risk Assessments Down to the block level for Kentucky. • CHR’s latest state plan relied on count data within blocks to develop a risk score. • CHR’s Risk score is a combination of Exposure and Hazard Risk • Using pure count data results in a rural bias for increased risk • Increased exposure • Larger blocks may have a higher population but lower density • Larger blocks may also contain more assets: Roads, Rail, Bridges. • Increased hazard risk • Larger Blocks also have more area exposed to a hazard and may potentially be affected by more incidents due to the increased area
Dasymetric Mapping Method of mapping population within an aggregation area using population data and land cover data http://pubs.usgs.gov/fs/2008/3010/fs2008-3010.pdf
USGS Dasymetric Mapping Tool • A free tool which simplifies the Dasymetric process • Requires Land Cover data to be broken down into 4 Classes • User defined breaks • Suggests – • High Density • Low Density • Non-Urban Inhabited • Uninhabited • Link: http://geography.wr.usgs.gov/science/dasymetric/ • Or Google: Dasymetric Mapping USGS
USGS Dasymetric Tool Key functions • Empirical Sampling • Empirical sampling is used to determine the fraction of the census unit's population that should be allocated to each inhabited class for the study area • Areal Weighting • The ‘population density fraction’ must be adjusted by the percentage of the block-group’s total area that each ‘inhabited class’ occupies. A ratio is calculated for each ‘inhabited class’ representing the percentage of area that an ‘inhabited class’ actually occupies within a block group to the expected percentage. The area ratio is used to adjust the ‘population density fraction’ accounting for the variation of both the population density and area for the different ‘inhabited classes’ for each block group. Source: http://geography.wr.usgs.gov/science/dasymetric/data/ToolDescription.docx
Land Cover Data Issues • Low Resolution • In non urban areas, there may not be a differentiation in land class between a residence and the surroundings • Resolution is typically able to differentiate roads from surroundings in rural areas • Assumption is population typically lives near roads • Developed Areas that are uninhabited can show as high density development • Use Feature Classes to reclassify raster areas to eliminate developed areas that are uninhabited • Highways • Airport • Block level data often finite enough that industrial areas are separated from residential areas and show no population
Military Grid Reference System • MGRS could provide an alternative aggregation level to the Census Block level • Each unit is identical in size • Allows better comparisons between units in different parts of the state • Population and demographic data is not calculated at MGRS level • Assign proportionally based on area • Assign using Dasymetric mapping based on area
Grid Advantages For Population Mapping • Grid will enable a like to like comparison of areas across the state rural or urban • Population is compared in an equal area • Better and easier to view visuals every polygon is equal area • A group of small highly populated blocks (Downtown areas) will now be as visible as suburban areas.
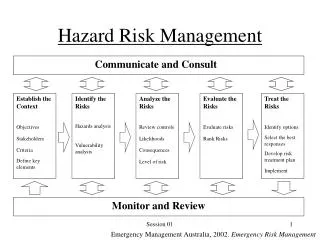
Kentucky State Hazard Mitigation Plan Risk Assessment Hazard Vulnerability Score = Exposure Score X Risk Score • Risk Score = Probability of an event X actual consequences (loss) and the % area of each unit that is probable to be affected by an event. • The % area is calculated for hazards that have a defined and predictable spatial extent. For example; Flooding (DFIRM), Karst (KGS), Land Subsidence (KGS), and Landslide (KGS)
Kentucky State Hazard Mitigation Plan Exposure Score Exposure Score= Population Rank + Property Rank + Essential Facilities Rank + Utility Rank + Transportation Rank + Government-Owned Facilities Rank + Hazardous Materials Rank Included raw counts and provided a rank (0-3) for each one and then each was added together and ranked again
Next Steps and Issues • Build state wide risk assessment using dasymetric modeling and an equal area grid • Need Better Land Use Data • LIDAR • With Buildings • Building Footprint data • Better understanding of where population is • Better comparison of different areas • Takes a Census count of population and creates an estimate