Download
1 / 46
470 likes | 708 Views
Long Term Storage Trends and You. Jim Gray Microsoft Research 28 Sept 2006. storage bricks 200x . Illiac Disk: 1968 . Minoan Phaistos Disk:1700 BC About 1KB No one can read it . What’s New / Surprising. Not a big surprise – just amazing! exponential growth in capacity

E N D
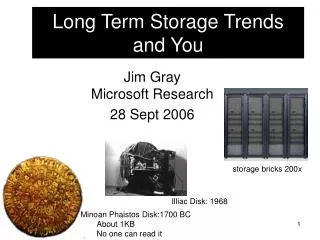
Long Term Storage Trends and You Jim GrayMicrosoft Research 28 Sept 2006 storage bricks 200x Illiac Disk: 1968 • Minoan Phaistos Disk:1700 BC • About 1KB • No one can read it
What’s New / Surprising • Not a big surprise – just amazing! • exponential growth in capacity • latency lags bandwidth • 5 minute rule is 30 minute rule • FLASH is coming • low end storage (GBs now 100 GBs soon) • low latency storage (fraction of ms) • high $/byte but good $/access • Smart Disks still seem far of, but...
To Blob or Not To Blob (½) • Folklore: • DB is good for billions of small things • Files are good for thousands of big things • Put another way: • DB is bad at big objects • Files Systems have trouble with billions of files. • This is a fact, not a law of nature • DB and FS could learn each others tricks. • But… what is “big” and “small”? Put another way: what is break-even size?
To Blob or Not To Blob (2/2) • Folklore: BLOBS win for things less than 1MB. • Refinement:If fragmentation, BLOBs win below 250KB. • Humor: most files are less than 250KB. (but most bytes are in big files). “To BLOB or Not To BLOB: Large Object Storage in a Database or a Filesystem?” Russell Sears, Catharine Van Ingen, Jim Gray,MSR-TR-2006-45, April 2006
How Reliable are Cheap Disks? (1/5) • Prices, Specs, and Gurus suggestSCSI good SATA bad. • 3x cheaper but… • 10x shorter MTTF • 10x shorter warranty • 100x higher Uncorrectable Error on Read (UER) • Spec Sheet says 1 UER every 10 Terabytes! • So, we measured and here is what we saw…
How Reliable are Cheap Disks? (2/5) DISK DRIVE FAILURES • Things fail much more often than predicted • Vendors say 0.5% /year • Customers see ~ 10x that rate • Vendors say: • 60% are no trouble found • 30% are mis-handling (dropped/cooked/bent pins) • 10% are real failures. • Will UERs be worse than the specs?We need to worry about ctlr, pci, ram, software,…
How Reliable are Cheap Disks? (3/5) • For the record: “Empirical Measurements of Disk Failure Rates and Error Rates,” Jim Gray, Catharine van Ingen, MSR-TR-2005-166, December 2005
How Reliable are Cheap Disks? (4/5) • The experiment: • Do 180,000 times (== 1.8PB ~ 1E16 bits) • Create and write 10GB disk file • Read it to check the checksum On various “office” systemsfor 4 months (~8 drive years) • Expected 114 UER events, Observed 3 or 4 UER events • Two events corrected by OS on retry -- 1 “real” one • no disk failures • a file-system corruption (due to controller we guess) • Many reboots due to security patches • ~4 system hangs (bad controllers / drivers). • UER better than advertised(checked end-to-end) • “Empirical Measurements of Disk Failure Rates and Error Rates,” MSR-TR-2005-166
Moral: Design For Failure (5/5) • Things break: • disks break • controllers break • systems break • software breaks • data centers break • networks break • Design for independent failure modes • guard against operations errors • guard against “sympathetic failures” • guard against viruses • Simple recovery is testable “The cost of reliability is simplicity.Few are willing to pay that price” T. Hoare
It’s Hard to Archive a PetabyteIt takes a LONG time to restore it. • At 1GBps it takes 12 days! • Store it in two (or more) places online.A geo-plex • Scrub it continuously (look for errors) • On failure, • use other copy until failure repaired, • refresh lost copy from safe copy. • Can organize the two copies differently (e.g.: one by time, one by space)
Why 4 copies • duplex storage masks MOST failures • But,.. when one is broken you are worried • So, triplex it (a la GFS, Cosmos, Blue)… • And… you need geo-plex anyway • So, why not 2+2 rather than 3+3? • Symmetric and simple == good.
Meta-Message: Technology Ratios Matter • Price and Performance change. • If everything changes in the same way, then nothing really changes. • If some things get much cheaper/faster than others, then that is real change. • Some things are not changing much: • Cost of people • Speed of light • … • And some things are changing a LOT
The Perfect Memory (ratio problems) ∞ capacity ~100tx/s and ~100 MB/s • Store name-value pairs • Read value given name (or predicate?) instantly! • Capacity has grown ~2x/year (or 2x/2y) • But ratios are changing: • Latency lags bandwidth(Patterson http://portal.acm.org/citation.cfm?id=1022596) • Bandwidth lags capacity • Pipelining (prefetch) can hide latency • No way to fake bandwidth – you have to pay for it!
Find Useful Ways To “waste” Space ∞ capacity ~100tx/s and ~100 MB/s • 1 TB disks now • 100TB disks in 10 years? (or….) • Cost: ~ $1GB now, 10$/TB in future • Smart disks eventually (or now if you count xbox, ipod, …) • Petabyte: 1,400 disks now 140 disks in 2012 • Simple math • ~30M seconds/year, • 1GBps == ~30 PB/y • Find creative ways to “waste” 99% of capacity but not use any bandwidth (ice cold data)
Technology Trends ∞ capacity ~100tx/s and ~100 MB/s • 1 TB disks now • 100TB disks in 10 years? (or….) • Cost: ~ $1GB now, 10$/TB in future • Smart disks eventually (or now if you count xbox, ipod, …) • Petabyte: 1,400 disks now 300 disks in 2010 • Simple math • ~30M seconds/year, • 1GBps == ~30 PB/y
Technology Trend: Implication ∞ capacity ~100tx/s and ~100 MB/s • Find creative ways to “waste” 99% of capacity but not use any bandwidth (ice cold data) • “replication” • “snapshots” • “archive” • Pipeline-Prefetch rewards • sequential access patterns • very large transfers • large == 1MB now, • large == 100MB in future • Dataflow programming: “stream” data to programs.
Technology Trend: Implication ∞ capacity ~100tx/s and ~100 MB/s • Q: For an infinite disk, how long does it take to • check disk (scrub) • defragment • reorganize • backup • A: A LONG time • Doing all four takes 4x longer • Nightly/weekly << 4xInfinity • Short-term fix: • combine utility scans • one pass algorithms. • Van Ingen: “Where have all the IOPS gone?”MSR-TR-2005-181
Free Storage: like free puppies • Storage is cheap (1k$/TB) • Storage management is not100K$ /TB /Year (or less… )opX > 100 capX • Goal opX << capX
Trends: Moore’s Law • Performance/Price doubles every 18 months • 100x per decade • Progress in next 18 months = ALL previous progress • New storage = sum of all old storage (ever) • New processing = sum of all old processing. • E. coli double ever 20 minutes! 15 years ago
Storage Capacity Beating Moore’s Law 500$/TB today (raw disk) 50$/TB by 2010 2005: shipped 350M drives (28% increase over 2004)~ 0.1 Zeta Byte (!)
Trends: Magnetic Storage Densities 2006: Seagate in lab @ 275ktpi, 1,730 kbpi 421 gbps 735 Mbps Limit: 50 tbpsi (100x density) • Amazing progress • Ratios have changed • Improvements:Capacity 60%/yBandwidth 40%/yAccess time 16%/y
Consequence of Moore’s law:Need an address bit every 18 months. • Moore’s law gives you 2x more in 18 months. • RAM • Today we have 1 GB to 1 TB machines(30-40 bits of addressing) • In 9 years we will need 6 more bits: 36-46 bit addressing (64GB - 64TB ram). • Disks • Today we have 10 GB to 10 TB files & DBs(33-43 bit file addresses) • In 9 years, we will need 6 more bits40-50 bit file addresses (1 PB files (! (?)))
How much storage do we need? Yotta Zetta Exa Peta Tera Giga Mega Kilo Everything! Recorded • Soon everything can be recorded and indexed • Most bytes will never be seen by humans. • Data summarization, trend detection anomaly detection are key technologies See Mike Lesk: How much information is there: http://www.lesk.com/mlesk/ksg97/ksg.html See Lyman & Varian: How much information http://www.sims.berkeley.edu/research/projects/how-much-info/ All BooksMultiMedia All LoC books (words) .Movie A Photo A Book 24 Yecto, 21 zepto, 18 atto, 15 femto, 12 pico, 9 nano, 6 micro, 3 milli
Storage Latency: How Far Away is the Data? Andromeda 9 10 Tape /Optical 2,000 Years Robot 6 Pluto Disk 2 Years 10 1.5 hr Olympia 100 Memory This Campus 10 10 min On Board Cache 2 On Chip Cache This Room 1 Registers My Head 1 min
Storage Hierarchy : Speed & Capacity vs Cost Tradeoffs 15 4 10 10 12 2 10 10 9 0 10 10 6 -2 10 10 Price vs Speed Size vs Speed Offline Cache Nearline Main Disc Tape Tape Secondary Online Secondary Online $/GB Disc Typical System (bytes) Main Nearline Offline Cache -9 -6 -3 0 3 -9 -6 -3 0 3 10 10 10 10 10 10 10 10 10 10 Access Time (seconds) Access Time (seconds)
Disks: Today • Disk is 30GB to 1 TB10-80 MBps5k-15k rpm (6ms-2ms rotational latency)10ms-3ms seek$/TB: .5K$/ATA, 1.2k$/SCSI • For shared disks most time spent waiting in queue for access to arm/controller Wait Transfer Transfer Rotate Rotate Seek Seek
The Street Price of a Raw disk TB about 1K$/TB 12/1/1999 9/1/2000 9/1/2001 4/1/2002 9/20/2006
Standard Storage Metrics • Capacity: • RAM: MB and $/MB: today at 4GB and ~100$/GB • Disk: GB and $/GB: today at 700GB and 500$/TB • Tape: TB and $/TB: today at 400GB and 300$/TB (nearline) • Access time (latency) • RAM: 1…100 ns • Disk: 5…15 ms • Tape: 30 second pick, 30 second position • Transfer rate • RAM: 1-10 GB/s • Disk: ~50 MB/s - - -Arrays can go to 1GB/s • Tape: ~50 MB/s - - - Arrays can go to 1GB/s
New Storage Metrics: Kaps, Maps, SCAN • Kaps: How many kilobyte objects served per second • The file server, transaction processing metric • This is the OLD metric. • Maps: How many megabyte objects served per sec • The Multi-Media metric • SCAN: How long to scan all the data • the data mining and utility metric • And • Kaps/$, Maps/$, TBscan/$
More Kaps and Kaps/$ 1 TB 70 MB/s • Disk accesses got much less expensive Better disks Cheaper disks! • But: disk arms are expensivethe scarce resource • 5 hour Scanvs 5 minutes in 1990 Assumptions: 15krpm, Dell TPC-C pricing for scsi disks cabinets and controllers depreciated over 3 years.
Data on Disk Can Move to RAM in 10 years 100:1 10 years
The “Absurd” Disk Has Arrived • 2.5 hr scan time (poor sequential access) • 1 kaps / 10 GB (VERY cold data) • It’s a tape! 1 TB 100 MB/s 100 Kaps
FLASH: The Gap Filler? • Flash chips are 4GB today – cards 64GB. • 20$/GB • 1/5 RAM price • but 20x disk price, but 20x better kaps • Predicted to double each year to Tbit • doubled each year since 1997 • Will eat disk market from below • cameras, ipods, … then laptops… then… • similar to cost/page or cost/first-page in printers • Block-oriented read-write (2KB) • 20MB/s per chip • read 16 chips in parallel (64KB page, 320MB/s • ~125 μs latency on read (25 fixed, 100 transfer) • Write has 2ms latency (clear the page) • Pages can only be written 1M times (approximately). ~80$ package
Flash CERTAINLY Represents an Opportunity To Rethink • A Non-Volatile disk buffer (inside drive?) • Low latency (100us) cache near cpu • WAL Cache for Databases • Quick restart • FLASH is a block oriented deviceIt likes read/write sequential It likes “big” (64KB reads/writes) “A Design for High-Performance Flash Disks” Andrew Birrell; Michael Isard; Chuck Thacker; Ted Wobber December 2005,MSR-TR-2005-176
Best Index Page Size >64KB small page has few entries, so little benefit big pages waste ram and bandwidth Best near 100KB
Summarizing storage rules of thumb (1) • Moore’s law: 4x every 3 years 100x more per decade • Ratios change!!! • Implies 2 bit of addressing every 3 years. • Storage capacities increase 100x/decade • Storage costs drop 100x per decade • Storage throughput increases 10x/decade • Data cools 10x/decade • Disk page sizes increase 5x per decade.
Summarizing storage rules of thumb (2) • RAM:Disk and Disk:Tape cost ratios are 100:1 and 1:1 • Prices decline 100x per decade, so, in 10 years, disk data can move to RAM. • A person should be able to administer a million dollars of storage: that is ~1PB today • Disks are replacing tapes as backup devices.You can’t backup/restore a Petabyte quicklyso geoplex it. • Mirroring rather than Parity to save disk arms
Amdahl’s Balance Laws • parallelism law: If a computation has a serial part S and a parallel component P, then the maximum speedup is (S+P)/S. • balanced system law: A system needs a bit of IO per second per instruction per second:about 8 MIPS per MBps. • memory law:=1:the MB/MIPS ratio (called alpha ()), in a balanced system is 1. • IO law: Programs do one IO per 50,000 instructions.
Amdahl’s Laws Valid 40 Years Later? • Parallelism law is algebra: so SURE! • Balanced system laws? • Look at tpc results (tpcC, tpcH) at http://www.tpc.org/ • Some imagination needed: • What’s an instruction (CPI varies from 1-3)? • RISC, CISC, VLIW, … clocks per instruction,… • What’s an I/O?
TPC systems: Disk/CPU and I/B MHz/ cpu CPI mips KB/ IO IO/s/ disk Disks Disks/ cpu MB/s/ cpu Ins/ IO Byte Amdahl 1 1 1 6 8 TPC-C= random 3000 2.1 1400 8 120 100 25 100 14 TPC-H= sequential 2400 1.2 2000 64 900 176 44 2200 1 • Normalize for CPI (clocks per instruction) • TPC-C has about 14 ins/byte of IO • TPC-H has ~1 ins/byte of IO
TPC systems: What’s alpha (=MB/MIPS)? Hard to say: • Intel 32 bit addressing (= 4GB limit). Known CPI. • IBM, HP, Sun have 64 GB limit. Unknown CPI. • Look at both, guess CPI for IBM, HP, Sun • Alpha is between 4 and 16
Instructions per IO? • We know 8 mips per MBps of IO • So, 8KB page is 64 K instructions • And 64KB page is 512 K instructions. • But, sequential has fewer instructions/byte. (3 vs 7 in tpcH vs tpcC). • So, 64KB page is 200 K instructions.
The Five Minute Rule • Trade DRAM for Disk Accesses • Cost of an access (Drive_Cost / Access_per_second) • Cost of a DRAM page ( $/MB/ pages_per_MB) • Break even has two terms: • Technology term and an Economic term • Grew page size to compensate for changing ratios. • Now at 5 minutes for random, 10 seconds sequential
The 5 Minute Rule Derived Disk Access Cost /T DiskPrice . AccessesPerSecond Breakeven: RAM_$_Per_MB = _____DiskPrice . PagesPerMB T x AccessesPerSecond ( )/T Cost a RAM Page RAM_$_Per_MB PagesPerMB $ T =TimeBetweenReferences to Page T = DiskPrice x PagesPerMB . RAM_$_Per_MB x AccessPerSecond
Plugging in the Numbers • Trend is longer times because disk$ not changing much, RAM$ declining 100x/decade 30 Minutes & 30 second rule
What’s New / Surprising • Not a big surprise – just amazing! • exponential growth in capacity • latency lags bandwidth lags cpacity • 5 minute rule is 30 minute rule • FLASH is coming • low end storage (GBs now 100 GBs soon) • low latency storage (fraction of ms) • high $/byte but good $/access • Smart Disks still seem far of, but...