Download
1 / 8

E N D
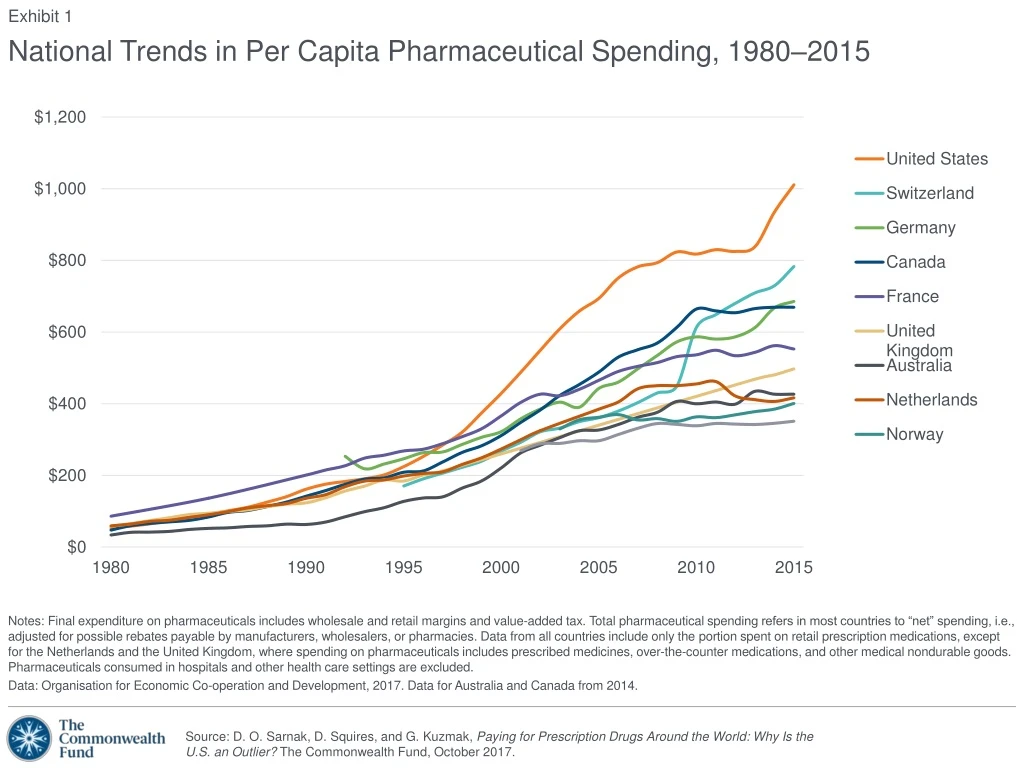
Notes: Final expenditure on pharmaceuticals includes wholesale and retail margins and value-added tax. Total pharmaceutical spending refers in most countries to “net” spending, i.e., adjusted for possible rebates payable by manufacturers, wholesalers, or pharmacies. Data from all countries include only the portion spent on retail prescription medications, except for the Netherlands and the United Kingdom, where spending on pharmaceuticals includes prescribed medicines, over-the-counter medications, and other medical nondurable goods. Pharmaceuticals consumed in hospitals and other health care settings are excluded. Data: Organisation for Economic Co-operation and Development, 2017. Data for Australia and Canada from 2014. Exhibit 1 National Trends in Per Capita Pharmaceutical Spending, 1980–2015
Notes: Final expenditure on pharmaceuticals includes wholesale and retail margins and value-added tax. Total pharmaceutical spending refers in most countries to “net” spending, i.e., adjusted for possible rebates payable by manufacturers, wholesalers, or pharmacies. Data from all countries include only the portion spent on retail prescription medications, except for the Netherlands and the United Kingdom, where spending on pharmaceuticals includes prescribed medicines, over-the-counter medications, and other medical nondurable goods. Pharmaceuticals consumed in hospitals and other health care settings are excluded. All health care spending estimates exclude capital formation. Data: Organisationfor Economic Co-operation and Development, 2017. Exhibit 2 Retail Pharmaceutical Spending, 2015
Notes: Data not available for Sweden. Data represent the total pharmaceutical market in Canada, Norway, and Switzerland. Data represent the reimbursed pharmaceutical market in Australia, France, Germany, the Netherlands, and the United Kingdom. Data represent the community pharmacy market in the United States. Data from 2014 in all countries except in Canada and France (2013), the U.S. (2012) and Australia (2007). Data: Organisation for Economic Co-operation and Development, 2016. Exhibit 3 Share of Generics in Pharmaceutical Markets Percent
Notes: Data not available for the Netherlands, Norway, or Sweden. Weighting is based on a Laspeyres index. See Kanavos et al. 2013 for further details. Data: P. Kanavos, A. Ferrario, S. Vandoros et al., “Higher U.S. Branded Drug Prices and Spending Compared to Other Countries May Stem Partly from Quick Uptake of New Drugs.” Health Affairs,April 2013 32(4):753–61. Exhibit 4 Retail Price Index for Pharmaceuticals, 2010 GER95 CAN50 UK46 FRA61 US100 SWIZ88 AUS49
Exhibit 5 Monthly Price of Six Top-Selling Prescription Drugs Average U.S. discount Note: Data not available for the Netherlands, Norway, or Sweden, nor for Australia in the case of Sovaldi. Data: R. Langreth, B. Migliozzi, and K. Gokhale, The U.S. Pays a Lot More for Top Drugs Than Other Countries (Bloomberg, Dec. 18, 2015).
Data: 2016 Commonwealth Fund International Health Policy Survey of Adults in 11 Countries. Exhibit 6 Adults Who Cited Cost as a Reason for Skipping Prescriptions or Doses, 2016 Percent
Data: 2016 Commonwealth Fund International Health Policy Survey of Adults in 11 Countries. Exhibit 7 Adults Who Cited Cost as a Reason for Skipping Prescriptions or Doses, by Health Status, 2016 Percent
Note: Population limited to adults ages 19 to 64 and with household poverty status at 200% of federal poverty level or lower. Data: The Commonwealth Fund Biennial Health Insurance Surveys (2003, 2005, 2007, 2010, 2012, 2014, 2016). Exhibit 8 Low-Income U.S. Adults Who Cited Cost as a Reason for Skipping Prescriptions or Doses, 2003–2016 Percent