Download
1 / 3
30 likes | 125 Views
Review of the Virginia Port Authority's financial performance for April 2013, highlighting actual vs. budgeted figures for operating revenues, facility rent, depreciation, maintenance, and more. Insights into net assets as of April 30, 2013.

E N D
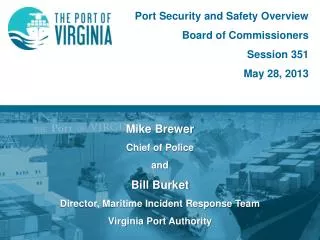
April 2013 Financial Report Board of Commissioners May 28, 2013
VIRGINIA PORT AUTHORITY & VIRGINIA INTERNATIONAL TERMINALS, INC.INCOME STATEMENT OPERATING REVENUES ACTUAL 276,749 BUDGET 266,316 FACILITY RENT 14.1% ACTUAL 38,984 BUDGET 40,527 DEPRECIATION 14.4% ACTUAL 39,914 BUDGET 39,310 OPERATIONS 45.5% ACTUAL 125,948 BUDGET 109,752 NON-OPER INC/EXP 5.3%ACTUAL 14,534 BUDGET 12,358 MAINTENANCE 16.8% ACTUAL 46,614 BUDGET 47,070 CAPITAL TRANSFERS 11.8% ACTUAL 32,684 BUDGET 31,057 ADMINISTRATION 14.0% ACTUAL 38,823 BUDGET 40,010 For The TenMonths Ended April 30, 2013 NET ASSETS ACTUAL 4,616 BUDGET 8,346 Page 1