Comprehensive Guide to Analyzing Chicken Gene Expression Data Using IPA
This guide provides step-by-step instructions for analyzing chicken gene expression data using the Ingenuity Pathway Analysis (IPA) software. It covers uploading expression values, creating new projects with metadata, applying filters, and interpreting mapped/unmapped data. Detailed instructions on running analyses, exporting networks, and customizing biological functions are included. Also discussed are TREM1 signaling pathways, statistical scoring, and how to build connections between interrelated genes. For further resources, refer to the IPA workshop documentation and training links.

Comprehensive Guide to Analyzing Chicken Gene Expression Data Using IPA
E N D
Presentation Transcript
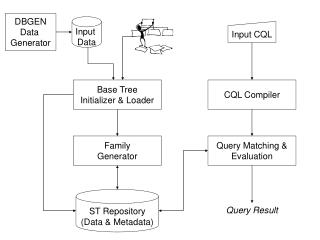
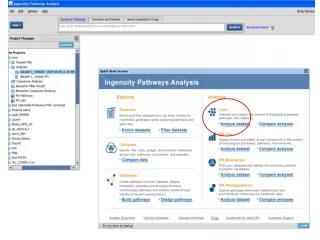
Users that have expression values (dataset 1_ chicken affy_foldchane.txt. can upload that file as shown in slide 30
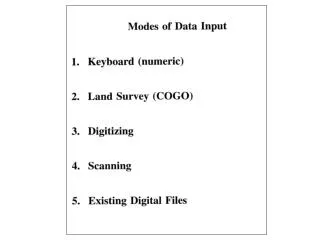
More information available in IPA_workshop.doc Input data format
Analysis settings Applying filters Information about mapped/unmapped data More information available in IPA_workshop.doc
Analysis summary Export
Select and view network Right click
Functions tab More information available in IPA_workshop.doc Biological functions
Customize functions
Molecular and cellular functions only Export options
Customize pathways Statistical scoring
Coverage i.e. ratio Of pathways
Networks tab. Genes have associated fold change (decrease (green) and increase (red))
TREM1 signaling Some IPA results are available in the folder entitled IPA_results
Connect all entities in the list Select all entities
Build connections applying all desired filters More information available in IPA_workshop.doc
Interconnected genes from the list Save as a new pathway
Saved list & pathway
Acknowledgement Ingenuity Pathways Analysis (web and help manual) IPA offers weekly (Thursday) training http://www.ingenuity.com/products/training.html Additional IPA resources http://www.ingenuity.com/library/index.html