Download
1 / 50
500 likes | 697 Views
If you are viewing this slideshow within a browser window, select File/Save as… from the toolbar and save the slideshow to your computer, then open it directly in PowerPoint. When you open the file, use the full-screen view to see the information on each slide build sequentially.

E N D
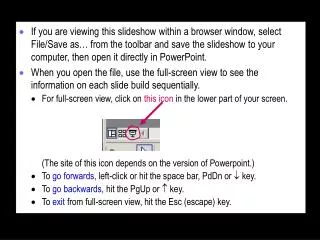
If you are viewing this slideshow within a browser window, select File/Save as… from the toolbar and save the slideshow to your computer, then open it directly in PowerPoint. • When you open the file, use the full-screen view to see the information on each slide build sequentially. • For full-screen view, click on this icon in the lower part of your screen. • (The site of this icon depends on the version of Powerpoint.) • To go forwards, left-click or hit the space bar, PdDn or key. • To go backwards, hit the PgUp or key. • To exit from full-screen view, hit the Esc (escape) key.
RESEARCH DESIGNS:Choosing and fine-tuning a design for your study Sources/AcknowledgmentsHopkins WG: Quantitative Research Design, Sportscience 4(1), 2000.Batterham AM, Hopkins WG: A Decision Tree for Controlled Trials, Sportscience 9, 2005.Hopkins WG, Marshall SW, Batterham AM, Hanin J: unpublished stats guidelines manuscript. Will G Hopkins AUT University, Auckland, NZ
Summary • Single-case studies • Qualitative • Quantitative clinical • Quantitative non-clinical • Sample-based studies • Inferences about Causation • Observational Studies • Interventions • Design and Analysis Issues • Observational studies • Case series • Cross-sectional study • Case-control and case-crossover • Cohort study • Interventions (Controlled Trials) • Pre-post single group • Post-only crossover • Pre-post crossover • Pre-post parallel groups • Post-only parallel groups • Decision Tree • Measurement studies • Validity • Diagnostic accuracy • Reliability • Factor structure • Reviews • Conclusions Click on the topic to link to the slides.
Single-Case Studies • Choose a single-case study when a phenomenon is novel or rare but difficult or inappropriate to study with a sample. • The case can exemplify identification, diagnosis, treatment, measurement or analysis. Qualitative Cases • These require open-ended interviews or other qualitative methods to solve a specific psychosocial problem involving an individual, team or organization. • Instrumental measurement may be difficult, limiting, or irrelevant. • Qualitative methods allow for serendipity and flexibility. • It’s OK to use such methods in your usual sample-based studies… • either in a pilot phase aimed at defining purpose and methods, • during data gathering in the project itself, • and/or in a follow-up assessment with stakeholders.
Consider using several methods to gather information, then demonstrate congruence of data and concepts (triangulation). • Plan to gather data until you reach saturation, when nothing new emerges from further collection or analysis. • Plan for feedback from respondents, peers and experts to address trustworthiness of the outcome. • Analyze by use of logic or common sense. Quantitative Clinical Case • This is an account of diagnosis or treatment of a case of injury or illness. • Choice and sequence of lab tests and assessment of signs and symptoms depend on current best practice and local incidence or prevalence of injuries or illness in the differential diagnosis. • Analysis is usually non-quantitative, but diagnosis can be quantitative by estimating odds in a Bayesian fashion.
Quantitative Non-Clinical Case • The aim is usually to quantify an effect for a single subject. • e.g., how does this subject respond to this strategy? • It is usually a sample-based study, in which you sample from the “population” of all possible repeated observations on the subject. • You make an inference about the effect statistic in this population. • Some of the usual sample-based designs are appropriate. • A control group is not possible with interventions. • “Sample size” is similar to that for simple interventions... • …because the observations are repeated measurements, and the smallest effect is the same as for usual sample-based studies. • So ~10 observations can be OK for a reliable dependent or a large effect. • The analytic model may need to account for autocorrelation. • Fitting a model usually removes autocorrelation from the consecutive residuals. Otherwise use econometric models.
Sample-Based Studies: Inferences about Causation • We study a sample to make an inference about the magnitude of an effect statistic in a population. • An effect statistic summarizes an association or relationship between a predictor (X) and a dependent variable (Y). • That is, a change in X is associated on average with a change in Y. • An association is most interesting and useful when a change in the predictor on average causes a change in the dependent… • because we can then make use of the association to enhance well-being, wealth or performance, • and we don’t understand an effect fully until we assess causality. • How we make an inference about causation depends on whether the study is observational or an intervention. Causation in Observational Studies • In these studies, “association is not [necessarily] causation”…
That is, X is related to Y, but changing X may not change Y. • e.g., activity is associated with health, but deliberately increasing activity may not affect health. Advising people to get active for their health would therefore be wrong. • In some designs, an association could be due to Y causing X. • e.g., a correlation between activity and health in a cross-sectional study could be due to disease making people inactive. • In all observational designs, confounders can cause an X-Y association. • e.g., an association between activity and health could be due to other factors (age, culture…) causing activity and health. • A complication is mediators or mechanisms, which are variables in the causal chain between X and Y. • e.g., fitness could mediate an effect of activity on health. • Confounders and mediators are known as covariates, because they covary with X and Y…
Effect of Confounders Effect of Mediators Covariates notconsidered • Confounding vs mediation by covariates in observational studies Z1 Effect of X on Yconfounded by Z1 Effect of X on Ymediated by Z2 X(activity) X X X Z1 (age) Z2 (fitness) Y(health) Y Y Y Effect of X on Ynotconfounded by Z1 Effect of X on Ynotmediated by Z2 Observed effect of X on Y Effects involving Z and X or Z and Y = + Effect of X on Y involving Z Effect of X on Y not involving Z
We are interested in X causing Y, so somehow we have to work out how much of the effect is not due to confounders. • And how much is mediated by a potential mechanism. • Solution: hold covariates constant, then measure the effect. • In observationalstudies, we hold confounders constant by… • studying a subgroup with equal values of potential confounders (also known as stratifying), • and/or by measuring potential confounders and adjusting or controlling for them by “holding them constant” in the analysis. • Adjust by including the covariate as a main effect in a linear model. • Include an interaction to estimate effect modification/moderation/modulation by the covariate: the adjusted effect differs for different values of the covariate. • Holding a covariate constant is also known as conditioning on the variable.
But holding covariates constant is usually problematic. • A covariate measured poorly adjusts poorly. • Covariates you don’t know about can’t be adjusted for. • Adjustment uses a model that may be inappropriate. • Adjustment for a covariate can even create bias, depending on its relationship with the predictor and dependent. • So, experts don’t trust trivial or small effects in observational studies, no matter how big the study. • And they infer that the true effect is substantial (i.e., at least small) only when the adjusted observed effect is at least moderate.
We also measure the contribution of a potential mechanism by including it as a covariate in the linear analysis model. • The analysisis the same as for confounders. • It’s up to you to distinguish between confounding and mediation, by reflecting on what is already known about the effect. • Beware you don’t adjust away the effect by mistaking a mediator for a confounder. • It’s easy to make mistakes with covariates in observational studies. • Consult an expert at the design and analysis stages.
Causation in Interventions • In an intervention, you deliberately change X and watch what happens to Y. X becomes an intervention or treatment. • So it is impossible to have confounding of the kind that occurs in observational studies. • No variable can “cause” the treatment. So an association between the treatment and Y is much more likely to be causal. • Bias can still occur, but in two other ways. • The change in Y could be coincidental. • Or it could arise from the act of intervening, not the treatment itself. • So, you include a group of the same kind of subjects treated in the same manner, but with a control or referencetreatment. • The difference (usually in the change) between the experimental and control groups is the unbiased effect of the treatment. • In diagrams, the bias can be attributed to mechanisms different from the specific mechanism of the treatment…
Mediators with Exptal Treatment T Mediatorwith Control Treatment C No Z can causeTreatment T • Confounding vs mediation by covariates in interventions Z Effect of T on Ymediated by Z1 T C T Z2 Z2 Z1 Z Y Y Y Observed effect of T on Y Effect of T on Ymediated by Z2 Effect of C on Ymediated by Z2 = effect due to mediator Z1 = unbiased effect of treatment T = experimental treatment effect minus control treatment effect.
The control group solves one major problem but creates others. • Any difference between groups in administration of treatments or compliance with study requirements can bias the effect… • …because the control group will no longer be a proper control. • Subjects who know which group they are in may also change their acute or chronic behavior, resulting in placebo and nocebo effects. • Hence the desirability of blinding researchers and subjects. • Any imbalance between the groups in a subject characteristic or other covariate related to the dependent will also bias the effect. • Substantial imbalance can occur by chance, if randomization is not balanced for the characteristic and sample sizes are small. • Strictly speaking, chance imbalance does not bias the effect, but you must adjust for any you notice, and a bonus is better precision. • Chance imbalance on the pre-test value of a noisy dependent results in an artifactual treatment effect via regression to the mean. • What to do about these differences between groups?
The effect of a difference between groups in administration, compliance or imbalance can be attributed to a mediator with different mean values in the groups. • So you adjust for the difference by including relevant covariates in the model (to hold them constant and equal). • This kind of diagram (showing adjustment for imbalance in the pre-test value of a dependent) helps to understand what happens: Difference in slopesimplies the pre-test valueof the dependent mediatesindividual differences inthe effect of the treatment. Post-pre changein dependent exptalgroup mean experimental effect adjustedto grand mean Negative slope in controldue to regression to mean. unadjustedeffect mean control E.g., treatment haszero net effect at this pre-test value. controlgroup • Similar diagrams explain adjustment for covariates in observational studies. 0 grandmean Pre-test value
For a mechanisms analysis, create a similar figure with the change score of the potential mechanism as the covariate. • You usually see an imbalance between the groups in the mean value of the change score of the covariate. • The treatment effect adjusted to zero change of the covariate is the effect not mediated by the covariate. Post-pre changein dependent mean experimental exptalgroup mean control adjusted effect(effect not due to covariate) 0 unadjusted (full) effectof treatment 0 Post-pre change in covariate controlgroup
And the difference between the unadjusted and adjusted effects on the dependent (not shown) is the contribution of the covariate. • Estimate the contribution from the linear model. • But such analyses provide only modest evidence of a mechanism. • The effects of the covariate (the slopes) in the two groups are attenuated by error of measurement (noise) in the covariate: you see slopes only when individual responses are not swamped by the noise. • In any case, changes in the covariate might not be the cause of changes in the dependent. • Strong evidence requires an intervention on the covariate. • As with observational studies, you can adjust for imbalance only in those covariates you know about and can measurewell. • Unknown non-random imbalance can produce bias in the estimates of the treatment effect and its mechanisms. • Noisy covariates do not estimate and adjust properly. • So be cautious about causation and especially mechanisms in interventions.
Sample-Based Studies: Generic Design and Analysis Issues • The aim is to estimate an effect, its uncertainty, and the effect of covariates (confounders, modifiers, mechanisms). • Choose the most cost-effective design and variables. • Interventions give better evidence of causality than observational studies. • And they usually require far less subjects. • But they are unethical for potentially harmful treatments. • And they are no good for long-term effects, because too many subjects fail to comply with study requirements. • Aim for a representative sample of a well-defined population. • Choose the sample randomly to minimize sampling bias. • Stratify the sampling to ensure the right proportion of subgroups. • Have a well-defined rationale for the samplesize. • If sample size is a problem, limit the study to a useful subgroup.
Measure all potentially important confounders and modifiers (subject characteristics and differences in conditions or protocols that could affect the effect). • Measure some potentially important mediators/mechanisms (variables that could be associated with the dependent variable because of a causal link from a predictor). • Consider including a pilot study aimed at feasibility of the logistics and/or validity or reliability of key variables.
You almost invariably analyze with some kind of linear model. • Linear models are additive models: the predictor variables are simply added together (each multiplied by a coefficient). • Such models automatically provide adjustment for covariates. • Add interactions (variables multiplied together) for effect modification. • A predictor multiplied by itself allows for quadratic or higher-order polynomial (non-linear) effects of the predictor. • The kind of linear model depends on the dependent variable. • If it’s continuous, use general linear models. • Allow for different errors in different groups and/or time points. • If it’s events or counts, use generalized linear models. • If it’s time to an event, use proportional hazards regression.
Sample-Based Observational Studies • In approx. ascending order of evidence they provide for causality: case series cross-sectional studies case-control studies cohort studies. Case Series • A clinical case series focuses only on patients with a condition: • e.g., all patients with a particular injury in a clinic. • One aim is to establish norms for characterizing and possibly treating the condition. • Another aim is to identify possible causes and effective treatments for injuries and other exercise-related conditions. • The outcomes are correlates of severity and treatment outcomes. • The design is then effectively cross-sectional: see later.
A non-clinical case series is used: • to establish norms of behaviors or skills; • to characterize components of specific movements or skills, e.g., wrist impact forces when gymnasts perform a maneuver. • Sample size • For characterizing norms, use one-quarter the usual size for cross-sectional studies, i.e., ~100. • Smaller samples establish noisier norms, which result in less confident characterization of future typical cases but acceptable characterization of future unusual cases. • Larger samples (~300+) are needed to characterize percentiles accurately, especially when the measure is not normally distributed. • Use ~300+ subjects, if the norms are to be used for group comparisons by you or other researchers. • For correlates of severity etc., use the usual sample size (~300+).
Cross-sectional Study • Here you explore the relationships between variables measured on one occasion (hence also known as a "snapshot"). • The aim is to identify characteristics associated with the presence or magnitude of something (hence also known as a “fishing expedition”). • OK for common conditions or when the dependent is continuous. • e.g., correlates of blood lipids. • But it’s sometimes unclear whether the predictor is a cause or an effect of the dependent. • Sample size: ~500; more for more variables. • Reviews and measurement studies are special kinds of cross-sectional study usually requiring smaller samples.
Case-Control Study • Cases of a condition of interest (e.g., an injury or disease) are compared with controls, who are free of the condition. • The aim is to estimate differences between the groups in subject characteristics, behaviors, or "exposures" to things that might cause the condition. • You go fishing for an exposure responsible for the cases. • A clear difference identifies a risk factor for the condition. • For rare conditions, sample size with this design is smaller than for a cohort study (but still large). • And it can be performed much faster than a cohort study. • But exposure data are obtained after the outcome has occurred. • So problematic when memories fail or records are poor, or if the exposure is a behavior affected by the condition; e.g., not good for addressing movement patterns as a risk factor for ACL injury, but excellent for its genetic risk factors.
To avoid selection bias with choice of controls… • Choose from the same population as the cases, preferably as each case appears (= incidence density sampling). • Match for subject characteristics that could be confounders, including time taken to develop the condition. • And match for known risk factors to improve precision of estimates. • Sample size: ~1000s; more for infrequent exposures. • Equal numbers of cases and controls is most efficient. • More of either gives more precision, but precision plateaus for >5:1. Case-Crossover • Here potential risk factors are assayed in the same subject in the “hazard window” prior to a harmful event (the case) and at other times (the control). • Excellent for transient factors (e.g., hormones, fatigue, stress) and outcomes that develop and resolve rapidly (e.g., acute injuries).
Cohort Study • Similar purpose as case-control studies, but you measure potential risk factors before the subjects develop the condition. • You go fishing for diseases (outcomes) arising from exposure(s). • In prospective cohort studies the cohort is measured then followed up over a period of months or years to determine the time of any occurrences of conditions. • Best of the observational designs, but… • Monitoring periods are usually years. • You’re stuck with the exposures you measured. • Subjects may change their behaviors or be lost to follow-up. • Sample sizes are feasible only for relatively common conditions. • In retrospective cohort studies the cohort is a defined group with good medical records of health outcomes and exposures. • Sample size: 1000s; more for uncommon conditions/exposures.
Sample-Based Interventions • You compare values of a dependent variable following a treatment or other intervention with those following a comparison or reference treatment known as a control. • In a clinical/practical setting the control is ideally best-practice. • Investigate more than one experimental treatment only when sample size is adequate for multiple comparisons. • To avoid selection and compliance biases, aim to randomize subjects to the treatment groups or sequences… • with subgroup proportions the same for each treatment; • with minimized differences in means of subject characteristics (by improvising reassignment of randomized subjects); • with researchers and subjects blind to the treatments; • with full adherence to study protocols, including no dropping out or other loss to follow-up.
If blinding is not possible, try to include a mechanism variable not affected by expectation (placebo and nocebo) effects. • The amount of the effect mediated by such a mechanism variable is unlikely to be due to expectation effects. • Choice of design is determined by need for evidence of causality, availability of subjects, reliability of the dependent, and time to wash out treatments. • In approximate ascending order of evidence they provide for causality, the designs are:pre-post single group post-only crossover pre-post crossover pre-post parallel groups post-only parallel groups. • This order coincidentally reflects increasing sample size.
Pre-post Single Group • Weakest design, because any change post treatment could be coincidental (especially with only one pre trial). • Journals seldom publish studies without a control group. Yours is more likely to get into print if you… • Explain that a controlled trial was logisticallydifficult. • Blind subjects to the treatment. • Mitigate the problem of coincidental change by: • having a series of baseline trials (also known as a time series); • making the total baseline time longer than the treatment period, to improve extrapolation from the baseline trials to the post trial; • starting the time series at different times with different subjects; • repeating the treatment with the same subjects after washout.
Within-subject modeling is an option for analysis: • Fit line or curve to each subject's baseline tests, extrapolate to the post-test(s), then use paired t or equivalent linear modeling with observed and predicted post-treatment values. • Sample size: can be smallest of all designs, but avoid <10.
washout • Post-only Crossover • Smallest sample size when reliability is high, but avoid <10. • Good for study of multiple treatments with quick washout. • Use “Latin square” sequences to get balance in treatment order: 3 treatments need multiples of 6 subjects (6, 12, 18…); 4 need multiples of 4; 5 need multiples of 10; 6 need multiples of 6… • You can estimate individual responses only by including a repeat of at least one of the treatments for each subject. • In the analysis, adjust for the order effect, if it is substantial and especially if numbers in the crossover groups are unequal.
washout • Pre-post Crossover • Best design to estimate effect of treatment on individuals, because every subject gets every treatment. • Sample size: 0.5 that for parallel groups, but 2 as many trials, so a saving on subjects but no saving on resources. Pre-post Parallel Groups • Most common type of controlled trial. • Sample size: ~4 that of post-only crossover, typically ~20-100+.
Post-only Parallel Groups • The controlled trial with the least disturbance to subjects. • The only possible type of intervention when the outcome is an event that doesn’t wash out, such as death or disabling injury. • Large sample size (300+) needed, but this size is smaller than for the usual pre-post designs for continuous variables with sufficiently poor reliability. • For continuous dependent variables, you can estimate individual responses as a standard deviation, but you can’t estimate responses of individuals.
Can you use a control group or control treatment? NO YES Is the measure reliable over the intervention period? NO YES Pre-postsingle group Will the intervention wash out in an acceptable time for a crossover? n=10+ NO YES Is the measure reliable over Post-only washout+intervention period? parallel groups n=300+ NO YES Are you limited Pre - post by subjects parallel groups or resources? n=20+ NO YES Pre - post crossover Decision Treefor Choosing theBest Intervention n=10+ Post - only crossover n=10+
Can you use a control group or control treatment? NO YES Pre-post single group n=10+
Is the measure reliable over the intervention period? NO YES Post-onlyparallel groupsn=300+
Will the intervention wash out in an acceptable time for a crossover? NO YES Pre-postparallel groupsn=20+
Is the measure reliable over washout+intervention period? NO YES Are you limited by subjects or resources? NO YES Pre-post Post-only crossover crossover n=10+ n=10+
Measurement Studies • These are varieties of cross-sectional studies aimed at measurement properties of variables. • Good for student projects. Try to include one in a PhD. Validity Study • …is an observational study of the concurrent relationship between a criterion and a practical or novel measure. • You measure both simultaneously on each subject, then model the relationship to derive validity statistics, which are used… • to determine how close practical values are to the real (criterion) • (the error of the estimate is the typical error in the assessment of an individual); • to take into account the impact of validity on design and analysis of other studies that involve the practical • (the validity r provides a correction for attenuation of effects).
Choose the most cost-effective criterion. • It needn’t be free of “noise” (irreducible random error in the criterion independent of the practical). • Assess contribution of noise to validity by including a very short-term reliability study of both variables. • Consider including an assessment of construct validity: correlations of the practical with other measures (constructs). • Sample size depends on expected magnitude of validity: • n = 10-20 of given type of subject for very high validity (r > 0.98); • n = 50-100 or more for more modest validity (r ~0.80). • Analysis: simple linear regression, not limits of agreement.
Study of Diagnostic Accuracy • This is another kind of validity study. • The criterion (reference standard) is a binary variable representing the true presence or absence of a condition. • The predictor (index test) is derived from one or more lab tests or other evaluations of the patient. • The measures of validity are expressed as diagnostically meaningful statistics (false positives, false negatives…). • Sample size: many hundreds, to determine the accuracy in patients with various characteristics (e.g., sex, disease stage). • Analysis: logistic regression; generalized linear modeling.
Reliability Study • This is an observational study of the reproducibility of values of a variable in the same subjects, usually between trials or measurements separated by a defined period. • Reliability statistics from such studies are used to: • determine uncertainty in changes when monitoring an individual; • determine sample size in designs using repeated measurement; • set an upper limit on validity (using a very short-term reliability study), when a validity study is difficult; • validity r (reliability r); error of estimate error of measurement; • determine smallest important change in competitive performance in solo sports and identify some factors affecting performance. • Reliability statistics can also represent reproducibility when the same subjects are measured by different raters or by different units of the same type of equipment.
Sample size is similar to that for validity studies, but no. of trials? • For laboratory or field tests, plan for at least four trials to properly assess habituation (familiarization or learning) effects. • Such effects usually result in changes in the mean and error of measurement between consecutive trials. • Estimation of error requires analysis of a pair of trials. • Therefore error for Trials 2 & 3, if smaller than for 1 & 2, needs comparison with 3 & 4 for to check for any further reduction. • Analysis: simple stats of change scores of consecutive pairs of trials; mixed modeling for complex repeated measurements. • Some journals do not accept simple reliability studies. A journal is more likely to accept yours if you: • use a good sample size and plenty of trials; • use several interesting subject groups; • estimate effects of time between trials, averaging of multiple trials, subject characteristics (sex, age, experience, training…), fatigue…
Study of Factor Structure • This is an observational study of relationships within and between groups of variables, usually sets of items in a questionnaire combined to produce measures of the psyche. • It is essentially a reliability study, in which the trials are items. • The measures are linear combinations of the items, known as dimensions or factors, which assay underlying constructs. • The aims of an exploratory factor analytic study are… • to identify the factors in a given realm of perception, attitude or behavior; • to quantify the relationship between the factors as correlations, unless they are derived to be independent (all correlations = 0); • to quantify the consistency of the responses for items in each factor as Cronbach’s alpha (“reliability of the mean” of the items). • (alpha) is the upper limit for the validity correlation of the factor.
Perform extensive pilot work with experts and subjects to develop or modify wording in an exploratory factor analysis. • Some studies involve confirmatory factor analysis, in which the properties of factors from an exploratory factor analysis are analyzed with a sample from a different population. • A given factor may be the most valid measure of that dimension of the psyche, but you should investigate construct validity: correlations of the factor with other measures or constructs. • Sample size: preferably ~1000, because… • the analysis is effectively based on all the correlations between dozens of variables, and… • most of the correlations are not very large, so… • the chance of spurious correlations and therefore flawed factors is high, unless the sample size is huge. • Analysis: linear models, including structural equation modeling.
Reviews • A review is a cross-sectional study in which the “subjects” are study-estimates of a given effect. • You have to do a review as part of your own study, but the remarks here are mainly for a stand-alone review publication. • If there are many publications on an effect, a good review is probably more valuable than another original study. • The review will help identify subjects or conditions that still need investigation. • Reviews are cited more often than other kinds of study! • A review is more publishable if… • at least one author is a productive expert on the topic, and • the review has novelty.
Aim for novelty via: • choice of topic; • inclusion of new studies since the last major review; • new insights or method of analysis. • Access studies via reference lists, Google Scholar, PubMed, SportDiscus or other discipline-specific bibliographic databases, the Cochrane register of controlled trials, and conference abstracts. • Sample size is invariably all the available study-estimates. • Required sample size depends on too many unknowns, but scores of studies usually produce a decisive outcome. • Analysis • If there are only a few studies (<10), opt for a narrative review. • Otherwise do a random-effect meta-analysis that includes covariates to account for different effects in different settings.
Conclusions • Do a case study if something novel has happened and you have enough information to make it interesting and publishable. • Do an observational study to identify substantial associations between predictors and an interesting dependent variable, but… • the sample sizes are large; • association is not necessarily causation; • adjusting for potential confounders is important but problematic. • Do an intervention if ethically and logistically feasible, because: • the sample sizes can be manageable, • inferences about causation can be conclusive. • Do a measurement study to determine the impact of noise in an interesting variable on assessing individuals and on design and analysis of other studies. • Do a review if there are sufficient studies and sufficient novelty.
This presentation was downloaded from: Reference: Hopkins WG. Research designs: choosing and fine-tuning a design for your study. Sportscience 12, 12-21, 2008