Analyzing Stock Trends Through Graphs: Importance of Highlighted Data
Understanding stock trends is crucial for investors, and this analysis focuses on how graphs illustrate fluctuations. Highlighted words in bold enable readers to quickly recognize key information, while images like the lizard visually represent concepts discussed in the content. Learning to interpret visual data is essential for effective organization and navigation of stock information. Useful sources are provided for further exploration, enhancing your grasp of stock management and strategy planning.

Analyzing Stock Trends Through Graphs: Importance of Highlighted Data
E N D
Presentation Transcript
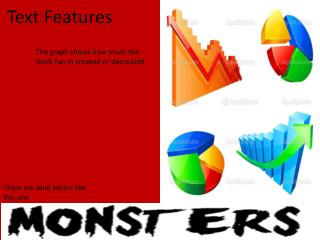
Text Features The graph shows how much the stock has in creased or decreased There are bold letters like this one
Highlighted words and pictures • The highlighted word helps the reader know that the word is important The picture of the lizard helps the reader what the book describes
Where I got the image https://play.google.com/store/apps/details?id=my.bal.b, http://www.waynelynch.ca/deserts_gallery23.html, http://depositphotos.com/1036581/stock-illustration-Vector-graphs-and-pies..html, http://www.google.com/url?sa=i&rct=j&q=&esrc=s&frm=1&source=images&cd=&docid=wlfNCyC0o1GNuM&tbnid=5gqrIy2WtJ_VIM:&ved=0CAUQjRw&url=http%3A%2F%2Fmarklindsayportfolio.blogspot.com%2F2012%2F05%2Fdsdn101-font-study-one-word-film.html&ei=TYcfUsKVH4OM2QWByIDYAw&bvm=bv.51495398,d.aWc&psig=AFQjCNHYFRzcYVT-fXNyTgWmeM9Q6EsT0A&ust=1377884336886129, http://www.123rf.com/photo_3848464_the-word-management-highlighted-with-a-yellow-marker.html Maps and bulletins Bulletins help us with organization • The shows where you are and where you are going to go