Cohort Studies
Cohort Studies . Dr. Amna Rehana Siddiqui & Prof Awatif Alam Prof Ashry Gad Department of Family & Community Medicine September 2013. Learning Objectives. To describe the types of Cohort Study designs with their advantages and disadvantages Calculate and interpret


Cohort Studies
E N D
Presentation Transcript
Cohort Studies Dr. AmnaRehanaSiddiqui & Prof Awatif Alam Prof AshryGad Department of Family & Community Medicine September 2013
Learning Objectives • To describe the types of Cohort Study designs with their advantages and disadvantages • Calculate and interpret • Risk : incidence in exposed and unexposed groups • Relative Risk as measure of Association • Attributable Risk as an estimate for prevention
What is a risk ? • Risk is the possibility of harm • Risk is the likelihood of an individual developing a disease/problem • In epidemiology risk is the likelihood of an individual in a defined population developing a disease or other adverse health problem
What is a risk ? • A risk factor is a characteristic associated with disease. • Measure risk and investigate that how this compares with other populations (relative measures) who do not have the defined risk. • The association between risk of disease ( individual and social characteristics ~ risk factors) is often the starting point for causal analysis
Population at risk All women (age groups) Total population Population at risk 0-25 years 25-69 years 25-69 years Men Women 70+ years Eg. Population at risk in a study of carcinoma of cervix
Basic Question in Analytic Epidemiology Are exposure and disease linked? Direction of inquiry in cohort study E D Exposure Risks e.g. Tobacco chewing Disease (outcome) e.g.Myocardial Infarction (MI)
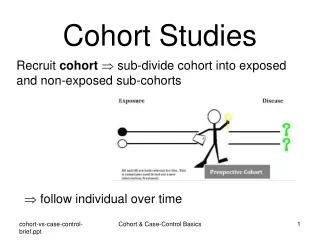
Design of Cohort StudiesWhat is a cohort ? • Cohort: group of individual with a common characteristic who are followed over a period of time e.g. A smoker’s cohort means all are smokers in that group • Selection of cohorts based on exposed and unexposed individuals to follow in specified time or until development of outcome (disease/death)
Cohort study design • A cohort, which is exposed to a suspected factor but not yet developed the disease, is observed and followed over time. • The incidence of the disease is measured directly in the two groups one exposed to a risk factor and other not exposed and then incidence rates are compared
Measuring occurrence of disease • Comparison of incidence proportion in both groups • Conceptually longitudinal to determine possible causal association between risk (exposure) and disease (outcome)
DEVELOP DISEASE DEVELOP DISEASE Design of a COHORT Study EXPOSED NOT EXPOSED DO NOT DEVELOP DISEASE DO NOT DEVELOP DISEASE
Cohort Study (Prospective) Disease occurs Exposed No disease Disease occurs Unexposed No disease 2011 Present Future time
Cohort Study (Retrospective) Disease occurs Exposed No disease Disease occurs Unexposed No disease Examine exposure in medical records /census/available data 1995 Past Present 2011
DEVELOP DISEASE DEVELOP DISEASE Defined population 2011 Current time Data from 1995/ Retrospective Prospective NON-randomized EXPOSED NOT EXPOSED Current time 2011 2025 DO NOT DEVELOP DISEASE DO NOT DEVELOP DISEASE Designs of a COHORT Study
The Framingham Study • Began in 1948 for Cardiovascular disease • A small town 20 miles from Boston in Massachusetts, USA • Population under 30,000 • Participants between 30-62 years of age • Follow up for 20 years • Sample size of 5000 Other famous cohorts include; British Physicians Cohort UK; Nurses Health Study USA, Women Health Initiative (WHI), Study of women across the nation (SWAN) in USA
Smoking Obesity Elevated blood pressure Elevated Cholesterol levels Physical activity New Coronary events determined by -Daily surveillance -Examination / 2 years Framingham StudyExposures Outcome
Nurses Health Study Nurses' Health Study, a large cohort study involving over121,700 women, who enrolled in 1976 from eleven states of USA; using a questionnaire in mail every two years to determine Exposure • Biological • Demographic • Hormonal • Lifestyle • Nutritional and • Other risk factors. Outcomes in • Chronic diseases, • Cancer in general • Cancers related to female reproductive tract
It is the best observational study design. Why? The investigator proceeds from “E to D” i.e. from cause to effect so he will not face a chicken egg dilemma and the temporal (time) sequence between E and D can be clearly established. It uses a control group to accept or reject the hypothesis between E and D.
Measuring Association in a Cohort Follow up in time of two groups defined by exposure status within a cohort or Follow up of two cohorts defined by exposure D=Death
Analysis: The basic analysis involves: • Calculation of incidence rates among the exposed • Calculation of incidence rates among the non-exposed • Incidence rate is expressed per unit time as: xx/100/Time , xx/1000/Time , xx/10000/Time or in person time denominator
Frame work of Analysis Incidence (a/a+b) (c/c+d ) • Ascertain whether there is a significant statistical association between exposure and disease. • Calculate chi-square or Z- test.
Relative risk (RR) Diseased Not diseased Exposed a b Unexposed c d RR = Incidence in exposed = a/a+b Incidence in unexposed c/c+d If causal association what is expected ? What does RR=1 means ?
Cohort Studies: Causal Association Onset of study Time Disease Eligible subjects Exposed No Disease Disease Unexposed No Disease Direction of inquiry
Interpretation of Relative Risk (RR) RR=1: No association between exposure and disease incidence rates are identical between groups RR> 1: Positive association (increasedrisk in exposed) exposed group has higher incidence than unexposed group RR< 1: Negative association (protective effect in exposed) unexposed group has higher incidence than exposed group
Example 1: Relative Risk Calculation Incidence in smokers = 84/3000 = 28.0/1000/yr Incidence in non-smokers = 87/5000 = 17.4/1000/yr Relative risk = 28.0/17.4 = 1.61
Example 2: Consider smoking & Coronary heart disease (CHD) in a population where we have data for exposure and outcome CHD in smokers 30% CHD in Non-smokers 15% 30/100 – 15/100 = 15/100 CHD risk is attributable to smoking RR of CHD is twice more in smokers than in non smokers (0.30/0.15=2)
Attributable Risk (AR) andAttributable Risk Fraction (ARF) • The Incidence of disease in the Exposed population whose disease can be attributed to the exposure. • AR=I e –I u • The proportion (fraction) of disease in the exposed population whose disease can be attributed to the exposure. • AR= (I e –I u )/I e I=Incidence. e= exposed, u=unexposed
Attributable Risk • Attributable risk in exposed (Example 1) = (28-17.4) / 1000 =10.6/1000 10.6 of the 28/1000 are attributable to smoking • Attributable risk % = (28-17.4) / 28 = 10.6/28 = 0.379 = 37.9% ~ 40%
Women Health Initiative Cohort RR= Calculate Incidence in exposed / Incidence in unexposed
Women Health Initiative Cohort RR= Calculate Incidence in exposed / Incidence in unexposed
Women Health Initiative Cohort RR= 0.26/0.21 = 1.24 Note how exposure is defined/whether No/Yes to exercise; if yes what will be RR ? (Hint: it will be protective and less than 1)
Potential Biases in Cohort Studies • Non response • Loss to follow up with time • Measurement errors in exposure
Advantages of cohort studies: Valuable in rare exposures. Can study multiple outcomes of a single exposure / risk factor. Exposure happened before outcome (Temporality) Can calculate incidence rates. Can quantify Risk, Relative risk, & Attributable Risk Dose response ratio can be calculated between exposure and disease and other outcomes. Low potential for bias than case-control study Can establish a natural history of disease when not known
Disadvantages of cohort studies: Attrition (loss to follow up) may affect validity of results. Measurement errors, multiple interviews, tests Involve a large sample Inefficient for evaluation of rare diseases. Takes a long time. Expensive.
Summary • Cohort studies are observational in nature and are useful in comparing risks in subgroups of populations within a specific time frame • Availability of data from previous years can lead to less expensive estimates for Risk, RR, and AR, using a retrospective cohort study • Prospective Cohort studies are expensive in time and resources, in addition to estimates of Risk, RR and AR , provide a causal link between risk factors and disease/other outcomes e.g. cancer.
Reference book & page number for the lecture resource Epidemiology by Leon Gordis. 3rd Edition. Elselvier & Saunders 2004 -Chapter 9 Cohort studies: pages 149-158. - Chapter 12 More on Risk : Estimating the Potential for prevention: pages 191-193