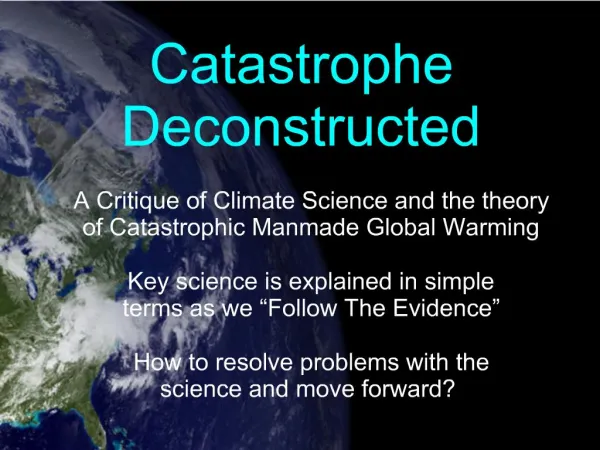
Catastrophe Deconstructed
A Critique of Climate Science and the theory of Catastrophic Manmade Global Warming Key science is explained in simple terms as we “Follow The Evidence” How to resolve problems with the science and move forward? . Catastrophe Deconstructed.

Catastrophe Deconstructed
E N D
Presentation Transcript
A Critique of Climate Science and the theory of Catastrophic Manmade Global Warming Key science is explained in simple terms as we “Follow The Evidence” How to resolve problems with the science and move forward? Catastrophe Deconstructed
The Case for Catastrophic Manmade Global Warming – Key Questions • What's the Story? • How do greenhouse gases work? • How do models arrive at catastrophic temperature forecasts? • What are the links between warming and other environmental changes?
Meet the CO2 record from Mauna Loa http://www.greenworldtrust.org.uk/Science/Scientific/MLO-emissions.htm
IPCC • Intergovernmental Panel on Climate Change • Set up in 1988 • UN advisory body on climate science • Over 130 countries are members • 2007 assessment report involved 3500+ scientists worldwide • Summaries of reports approved by scientific reps of all member countries • Including USA, Saudi Arabia
Records Seem to Speak Volumes CO2 in 2100 predictable from Mauna Loa chart “CO2 in air tracks our emissions exactly – rise has to be due to us” “CO2 rise unprecedented in Vostok chart – has to be due to emissions” “Recent temp. rise must be due to CO2 - too little solar change” “CO2 levels are rising further, with no end in sight” “Let's calculate the worst and get the message out!!!”
How Does Man Create CO2? A Hydrocarbon Water (H2O) + Carbon Dioxide (CO2) + Heat Oxygen (O2) + Traditional pollutants were fairly easy to eliminate • Pollutants like sulfates (SOx) are reduced by reducing impurities in the fuel and by scrubbing exhaust gases • Pollutants like ozone, carbon monoxide, and nitrous oxide are reduced by better combustion • Pollutants like carbon and ash are reduced by filtration But the only way to prevent carbon dioxide in emissions is not to burn fossil fuels - it is fundamental to combustion
Getting a Feel for CO2: GHG effect at different levels of concentration • <<<Without CO2 we would be 33 °C colder. Theory: most greenhouse effect happens with the first 50 ppm (parts per million), then it levels out • Current CO2 level in the atmosphere is about 385 ppm – red dot • A column of water with the same weight as the atmosphere is over 10m high (over 3 storeys) • Compared with this, CO2 ~ 4mm, the thickness of a wedding ring
∆T = F(C2) – F(C1) Where F(c) = Ln(1+1.2c+0.005c2+0.0000014c3) IPCC's graph-generating formula: ∆T = F(C2) – F(C1) where F(c) = Ln(1+1.2c+0.005c2+0.0000014c3) Likely CO2 Range by 2100 Likely CO2 Range by 2100
One Degree? What Are We Missing? • The Answer is – Feedback • High enough feedback leads to runaway tipping points • Venus is said to have runaway CO2 warming • Examples of positive feedback assumptions of models • Increase in atmospheric water content (relative humidity constant with rising temps = more H2O) • Increase in methane releases from northern tundra • Increase high cirrus clouds • Decrease in albedo from melting ice • Release of CO2 from warmer oceans
Feedback Multiplies or Reduces an Initial Disturbance Negative Feedback Positive Feedback • Disturbances are damped • System remains near its starting point, though it can oscillate • Disturbances are amplified • System may end up far from its starting point Final Value is 1/(1-f) times Initial Input Final Value is double the Initial Input when f=50%
Feedback 87% Feedback 75% Feedback 60%
Catastrophic Global Warming Theory Based on Two Chained Theories From Climate Positive Feedback Theory From Greenhouse Gas Theory
Do Rising Temperatures Lead to Other Negative Changes? • Changing rainfall patterns (drought in some areas, floods in others) • Melting ice and rising sea levels • Increase in hurricanes, tornadoes, severe storms • Rainforest loss, Species extinctions • Migration of tropical diseases to new areas • Or has alarmism been a natural but inappropriate emotional response to unchecked data?
Getting a Feel for CO2: Firn & Ice Core Formation Depth of ice at Vostok, Antarctica, extends to over 3 km depth 1 atmosphere pressure = 1000 millibars (mb - old) = 1000 hectopascals (hPa)
Six Key Questions • Is the world warming? • Is that warming due to man’s CO2 emissions? • Will future man-made warming be substantial? • Will we see catastrophic effects from warming? • Do warmist proposals for action make sense? • What do we really need to look at?
Historic Temperature Record shows warming of about 0.7°C Orange line is a centered 60 month moving average Lighter blue = switch to satellite data Source: Hadley CRUT3, UAH
Where's The Acceleration?Temperatures have been flat for a decade Source: Hadley CRUT, UAH
Tucson had Most Warming Since 1900Also most of rural USA (according to USHCN)
USHCN Weather Station SurveyTucson, Arizona Official weather station in a parking lot! I wonder what this looked like in 1900? Survey archived at www.WeatherStations.org
Bad Siting Frequently Found Surveys archived at www.WeatherStations.org
Measuring the Phoenix Urban Heat Island 5 to 10 Degrees F Meyer, 2008
With Urban Growth, Temperatures Go UpAdjustments Should Go Down – Not Up! S
More Improper Handling of Station Data?
Six Key Questions • Is the world warming? • Has been, but not beyond natural ranges; recent record probably overstated due to UHI etc; no warming in last 10 years • Is that warming due to man’s CO2 emissions? • Will future man-made warming be substantial? • Will we see catastrophic effects from warming? • Do warmist proposals for action make sense? • What do we really need to look at?
Atmospheric Equations With a little help from climate skeptics, the IPCC equations can be made to balance, showing the greenhouse effect as real and essential to life. But is it relevant to our emissions?
Early Ice Core Studies seemed to have found the Smoking Gun... CO2 appeared to be a strong driver of global temperatures… Source: IPCC AR4
...More Careful Measurements Reverse Findings, Suggest Another Cause...
...And Still More Careful Measurement Is Needed
Early IPCC Reports Found Current Temperatures to be Unexceptional... Reconstructed temperature anomaly Source: IPCC, 1990 AR1
...Pattern Affirmed by Looking At the World's Oldest Thermometer Record...
… but Mann’s Hockey Stick Shows Recent Warming as “Unprecedented”
Trickery Confirmed • Steve McIntyre investigates Mann's graph • Bristlecone pine data given 390-fold weighting to produce hockey stick shape • Michael Mann and others refuse to cooperate • McIntyre & McKitrick report to US government via Wegman Report • Mann's graph condemned by top statistician Wegman as worthless, but reporters fail to convey this, drawing on partisan North report instead. • Wegman Report also notes existence of tiny “Team” at the centre • RealClimate blog starts in 2005, covertly aiming to discredit climate skeptics, particularly Steve McIntyre • Steve responds by starting blog Climate Audit in January 2005 • Climategate eventually gives proof after proof of scientific trickery and bad behaviour now long suspected by Steve and others. McIntyre referred to in emails as “McFraudit”
“Hide the Decline” Mail Online, 13/12/2009 Trick #1: Overlay red instrumental data on proxies during calibration period, to make the “hockey stick blade” appear forcefully steeper Trick #2: No proxies shown in the last half of the instrumental record, since none go up that high & all would eventually diverge Tricks #3-4: Truncate Briffa's proxy data that declined too far below requirements – at both ends Climate Audit, 20/3/2011
Mann Flips Bad Proxy Upside Down -Tiljander's Finnish Lake Sediments Warmer Year More Organic Matter in Sediment Lower X-ray Density Mann 2008 (and others) Used the Proxy Upside-Down to Show Hockey Stick Warming Original Proxy Findings Sediments Disturbed by Agriculture (i.e. the proxy is meaningless anyway, in this period) Medieval Warm Period
YAD 061 From Russia With Love– most notorious tree in the world
Proxy Studies without those Questionable Series take us Back to the Traditional View
IPCC Models have a History of Incorrect Predictions
Current Lead Argument:Trust the Models. They say that warming is caused by Man because we can’t think of Anything Else It Could Be!