Download
1 / 50
500 likes | 659 Views
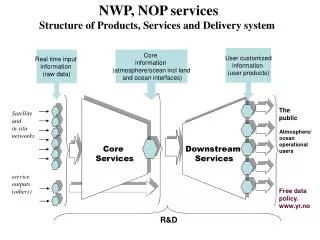
Confined Disposal Facilities and In Situ Capping. Site characterization / selection Engineering design Operational considerations Contaminant pathways and controls Long-term management Monitoring http://www.youtube.com/watch?v=Lbh9c0noR4s.

E N D
Confined Disposal Facilities and In Situ Capping • Site characterization / selection • Engineering design • Operational considerations • Contaminant pathways and controls • Long-term management • Monitoring • http://www.youtube.com/watch?v=Lbh9c0noR4s
Potential Contaminant Release Pathways for Dredging and Upland Disposal
Engineering Issues • Reduce Contaminant Pathways • Disposal pathways • Physical disturbance • Seepage • Optimize Capacity • Safely dispose of the greatest amount of material in the smallest area
Physical Disturbance • Excavation and removal of contaminated sediments • Erosion and Scour at the disposal site • Slope Stability • Nature of underlying materials • Stability of existing and future slopes • Intended end use of site • Consolidation and settling • Cap Properties
Seepage • Excess pore water in upland sites • Consolidation and compaction induced seepage • Groundwater-driven seepage
Other Considerations • Dredged disposal volume • Area of land desired • Habitat mitigation requirements • Cost comparisons
History of the Ross Island Sand & Gravel Site • July 1926 RISG acquires the islands and ownership is established over the area defined by the low water line surrounding the islands • October 1967 RISG issued removal permit following effective date of Oregon’s removal law • 1972 RISG proposed to mine entire islands away - denied by Oregon AG • 1972 RISG proposed to connect the northern ends of the islands forming a private pond - denied by COE
RISG History – Cont’d • 1979 RISG’s removal permit amended to include fill • 1980 City of Portland issued Conditional Use Permit specifying details of eventual reclamation • 1983 RISG began accepting fill materials from outside sources • 1992 first confined disposal event of Port of Portland dredged sediments
Potential Contaminant Migration Pathways - Disposal Processes
Potential Contaminant Migration Pathways - Groundwater Transport (Present and Future)
Potential Contaminant Migration Pathways - Physical Disturbance
Potential Groundwater Transport from Containment Cells • Upward groundwater flow • Cap design minimizes discharge via this sort of flow • Predicted discharge concentrations below risk-based criteria.
Potential Physical Disturbance of Containment Cells • Natural erosion (floods). • Human influence (mining). • Geotechnical stability.
Potential Physical Disturbance of Cells • Minimal erosion potential due to a control dike. • Mining controls would avoid future impacts. • Slopes are presently receiving fills.
RISG CDF: Conclusion • Final decision not yet made about CDF and the future of the island as a city park or preserve • Engineering studies strongly suggest the CDF is presently secure and presents an acceptable risk
GREENFill Areas ConsideredYELLOWFill Areas ProposedREDAreas to be Dredged
Wyckoff/Eagle Harbor W. Fish, Portland State University
Wyckoff/Eagle Harbor • Bainbridge Island, in Central Puget Sound • 3,780-acre site • Land use in the area is predominantly residential, with some commercial and industrial uses • The harbor supports several fish resources, a wide variety of resident and migratory birds, and other wildlife
Wyckoff/Eagle Harbor • Sources of Contamination: • Inactive 40-acre wood treating facility owned by Wyckoff • Adjacent 500-acre Eagle Harbor • Other upland sources of contamination (Shipyard)
Site History • Shipyard operated from 1903 to 1959 on the northwest shore of Eagle Harbor, resulting in releases of metals and organic contaminants. • 1905 to 1988, wood treating operations were conducted on the southeast shore involving pressure treatment with creosote and pentachlorophenol W. Fish, Portland State University
Discovery • During the 1970s, efforts were made to address oil seepage on beaches adjacent to the Wyckoff • 1984: NOAA investigations of the Harbor revealed that sediment, fish, and shellfish from Eagle Harbor contained elevated levels of PAHs W. Fish, Portland State University
The Response to Discovery • EPA required Wyckoff to conduct environmental investigation activities under RCRA • Washington State required immediate action to control stormwater runoff and seepage of contaminants
Response, Cont’d • September 1985: Proposed to the Superfund NPL • 1985:Washington State Hazardous Waste Cleanup Program, (Ecology): Preliminary Investigation of sediment contamination in Eagle Harbor
Response, Cont’d • 1985: NOAA completed a study relating the presence of PAHs in sediment to the high rate of liver lesions in English Sole from Eagle Harbor • March 1987, Wyckoff Company entered into an Administrative Order on Consent with EPA for further investigation of the facility (RI/FS)
Historical Sources • Preservative chemicals were stored in tanks on the property. • Contamination of soil and ground water at wood treatment facility led to seepage into adjacent sediments. • Wastewater discharged into Eagle Harbor for many years; storing treated pilings and timber in the water continued until the late 1940's. W. Fish, Portland State University
Contaminants of Concern • Shipyard: Levels toxic to marine life • Polyaromatic hydrocarbons (PAHs) and other organics • Heavy metals such as mercury, copper, lead, and zinc
Contaminants of Concern • Wyckoff facility, soil and groundwater are contaminated with: • Creosote • Accompanying PAHs • Pentachlorophenol (PCP; “penta”)
CERCLA Operating Units • 1991, EPA defined three operable units at the Wyckoff/Eagle Harbor site: • Wyckoff (OU1) • East Harbor (OU2) • West Harbor (OU3) • Wyckoff Facility groundwater (OU4, 1994) W. Fish, Portland State University
Selected Remedial Actions • Dredging, excavating dewatering intertidal sediment that exceeds levels of 5 mg/kg mercury and/or lower, moderate PAH concentrations • Approximately 1,000 to 7,000 cubic yards • Solidification/stabilization, as necessary, to comply with disposal rules • Transporting sediment, which cannot be treated to meet rules offsite for disposal at a RCRA-permitted (Subtitle C or D) landfill
Remedial Actions (cont’d) • Treating dewatering wastewater onsite using carbon adsorption before discharge into the harbor • Capping the sediment in areas of high concern with a 1- meter thick layer of clean sediment; • Placing a thin layer of clean sediment in subtidal areas of low to moderate concern to enhance natural sediment recovery
Remedial Actions (cont’d) • Long-term environmental monitoring • Institutional controls to prevent exposure to contaminated fish and shellfish. • The estimated cost is up to $16,000,000 • Most work done but site still on NPL
Eagle Harbor Cap Areas W. Fish, Portland State University
East Harbor Capping (OU2) • Sept 1993-March 1994, EPA and the Corps of Engineers covered contaminated sediments in the East Harbor • Cap of clean sediment at water depths of 17 m and 13 m, respectively. • Sediment was dredged from the Snohomish River as part of an annual project for ship navigation W. Fish, Portland State University
Capping Methods • Split Hull: Fast but uneven. W. Fish, Portland State University
Capping Methods • Hydraulic washoff: W. Fish, Portland State University
West Harbor CDF (OU3) W. Fish, Portland State University
Final sediment cleanup actions • Monitoring the success of natural recovery in intertidal areas • Monitoring contaminated areas where active remediation cannot be implemented.