Download
1 / 20
200 likes | 216 Views
Explore ALMA's superior imaging and spectroscopic capabilities in detecting normal galaxies at z=3, revolutionizing extragalactic astronomy with high-resolution images and precise CO line emission detection in distant galaxies.

E N D
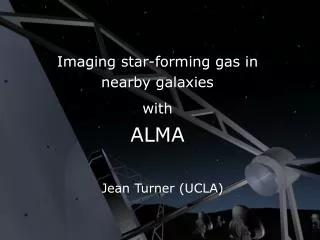
Normal/Starburst Galaxies at Low/Intermediate-z with ALMA Bologna, 2005 June 6
OVRO WHY ALMA? Strong limitation of Current mm Interferometers • In sensitivity(PdBI, the most sensitive)In Ang. Res.(bs max = 2km for BIMA, ~500m others)In Freq. Coverage (ALMA open sub-mm window)In Imaging capability (6 to 10 antennas only) ALMA factor 10-100 better in resolution ALMA @1.3 mm vs. PdBI sensitivity Continuum factor 100 better (6 µ Jy/beam in 1 hr)Spectral line factor 30 better(1.1 mJy/beam in 10 hr) Nobeyama Millimeter Array IRAM
Primary Goals for ALMA in Extragalactic Astronomy • The ability to detect spectral line emission from CO or CI in a normal galaxy like the Milky Way at a redshift of 3, in less than 24 hours of observation. • The ability to provide precise images at an angular resolution of 0.1” or better (0.01” at 650 GHz)to map the dust/molecular clouds structure in distant galaxies
Detecting normal galaxies at z=3 CO emission now detected in 25 z>2 objects. To date only in luminous AGN and/or gravitationally lensed in 1to 2 days of total obs. time. Normal galaxies are 20 to 30 times fainter.
Detecting normal galaxies at z=3 • Total CO luminosity of Milky Way: L’co(1-0) = 3.7x10⁸ K km s-1pc2(Solomon & Rivolo 1989). • COBE found slightly higher luminosities in higher transitions (Bennett et al 1994) → adopt L’co = 5x10⁸ K km s-1pc2. • At z=3 → observe (3-2) or (4-3) transition in the 84-116 GHz atmospheric band → need to correct, but also higher TCMB providing higher background levels for CO excitation. • Different models predict brighter or fainter higher-order transitions. Few measurements of CO rotational transitions exist for distant quasars and ULIRGs, but these are dominated by central regions. • → Assume L’co(3-2) / L’co(1-0) = 1.
Detecting normal galaxies at z=3 • For ΛCDM cosmology, Δv=300 km/s, the expected peak CO(3-2) flux density is 36 µJy. • 5σ detection achievable with ALMA in 12h on source (16h total time)
ALMA AS A REDSHIFT MACHINE • >50% of the FIR/submm background are submm galaxies. • Trace heavily obscured star-forming galaxies. • Optical/near-IR identification very difficult. • Optical spectroscopy: <z>~2.4. • Confirmation needed with CO spectroscopy.
mm continuum contours + HST optical image for the strongest SCUBA source in the HDF-N SCUBA image of the HDF-N Hughes et al. 1998 Downes et al. 2000
ALMA AS A REDSHIFT MACHINE • ALMA will provide 0.1” images of submm sources found in bolometer surveys (LABOCA/APEX, SCUBA-2/JCMT) or with ALMA itself. • 3 frequency settings will cover the entire 84-116 GHz band → at least one CO line.(1h per source) • Confirm with observation of high/lower order CO line. (1h per source)
PHOTOMETRIC REDSHIFTS FROM FLUX RATIOS • At z<1,the 1.4 GHz radio to 350 GHz submm flux ratio can provide an estimate of the source redshift (Carilli & Yun 1999) NB: valid for SBs. In AGNs radio excess is possible • At higher z,this flux ratio saturates one can use broad band SEDs obtained by observing in different ALMA bands to constrain the position of the redshifted 50-80 K hot dust peak Photometric methods not very accurate for single gals but useful to determine global z distributions
THE EFFECT OF DUST ON THE STAR FORMATION HISTORY Cosmic SFR density evolution with z show a peak at z = 1.5 – 3 (Blain et al. 2002) BUT effect of dust unknown since current sub-mm obs. limited to most extreme systems at such distances ALMA sensitivities of 10’s of µJy + sufficient resolution to avoid confusion (plaguing Single Dish obs.) normal star-forming gals at high z (SFR~10’s of MSun/yr)
PRECISE MAPPING OF SUB-MM SOURCES • Follow-up with ALMA: • High resolution CO imaging to determine morphology (mergers?), derive rotation curves → Mdyn, density, temperature, ... (1h per source) • Observe sources in HCN to trace dense regions of star-formation. (10h per source, 20 sources) • Total: 12h per source, 170h for sample of 50 sources.
M51 Galaxy (Whirlpool, NGC5195) Located at a distance of 37 million light-years from us, the famous M51 Galaxy (Sc type) was discovered in 1773 by Charles Messier. Due to its orientation in space, it is seen "face-on". Optical image of M51. Left : Continuum emission at 1.3 mm from the cold dust (<20K) contained in the spiral arms of M51 as observed with the 30m telescope. The pixel size in both images is 12 arc seconds. The continuum emission of cold dust closely follows the spiral pattern traced by the CO emission and correlates poorly with the emission from neutral hydrogen HI clouds. Similar results have been obtained by mapping the "edge-on" galaxy NGC 891, where the dust correlates well with the CO emission up to a radius of 25 thousand light-years from the center of the galaxy. Right: Map of the CO(2-1) emission from M51.
Obscured galaxyformation: low redshift (Meier & Turner 2004) IC342 • distance = 2 Mpc • M_gas = 4e7 M_sun • SFR = 0.1 M_sun/yr • Starburst age = 1e7 yrs 30” = 300pc colors OPTICAL Grey contours CO(1-0) White contours mm continuum
Nearby star forming Galaxies – Chemistry/Physics: IC342, D=2Mpc Meier & Turner 2004 CO: all gas 300pc HC3N: Dense C2H: PDRs ALMA: Image with GMC resolution (50pc) to 250 Mpc • Rich clusters: Virgo = 16 Mpc, Coma = 100 Mpc • ULIRGs: Arp 220 = 75 Mpc, Mrk 273 = 160 Mpc
Schinnerer et al., in prep. Nearby Gals II: Dynamics: ‘feeding the nucleus’ – NGC6946, D=5.5Mpc • PdBI 0.5” CO(2-1) • - Gas Lanes along Bar • Streaming Motions • Gas Disk w/ R <15pc • ALMA: extend to • Mrk 231 at 180 Mpc • Cygnus A at 240 Mpc 100 pc
Disentangling Nuclear Starbursts from AGNs • MAMBO survey of the cluster A2125 (Carilli et al. 2001) at 250 GHz • Detected sources not associated • with cluster galaxies. • Associated with mJy radio • sources (VLA) • Mostly dusty star forming • galaxies at median redshift 2.5 • - but also possible that heating • sources are AGN
Optically identified submm detected sources (only three so far) Two of them have large molecular gas masses (seen through CO emission) Dust continuum CO(3-2) emission z = 2.81 AGN Type II (Frayer & Scoville 1999) z = 2.56 Starburst 0.1” res. ~1 kpc at z~1 0.01” res. ~1 kpc at z~3
Power of IR Classification:Edge-on Spiral NGC 5746 Optical gri 2MASS JHK Spitzer/IRAC 3 -10 mm Frei al. 1996 (AJ, 111, 174) Jarrett et al. 2003 (AJ, 125, 525) • Prominent dust lane in optical (and even near-IR) prevents unambiguous classification • IR images demonstrate class "Sab" with ring • Star formation concentrated along ring and outside it
NGC 5128 - Centaurus A Visible image IRAC image Keene et al. 2004