Download
1 / 42
490 likes | 876 Views
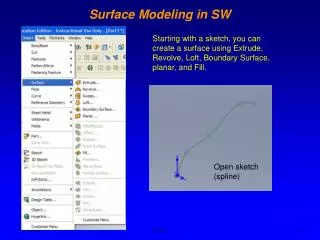
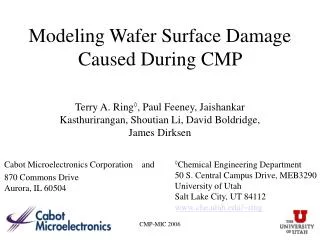
Modeling Wafer Surface Damage Caused During CMP. Terry A. Ring ◊ , Paul Feeney, Jaishankar Kasthurirangan, Shoutian Li, David Boldridge, James Dirksen. Cabot Microelectronics Corporation and 870 Commons Drive Aurora, IL 60504. ◊ Chemical Engineering Department

E N D
Modeling Wafer Surface Damage Caused During CMP Terry A. Ring◊, Paul Feeney, Jaishankar Kasthurirangan, Shoutian Li, David Boldridge, James Dirksen Cabot Microelectronics Corporation and 870 Commons DriveAurora, IL 60504 ◊Chemical Engineering Department 50 S. Central Campus Drive, MEB3290 University of Utah Salt Lake City, UT 84112 www.che.utah.edu/~ring CMP-MIC 2006
Overview • Description of Surface Damage • Fracture Mechanics • Description of Surface Damage Experiments • Description of Surface Damage Model • Two Simultaneous Population Balances • Under Wafer Impurity Particles • Surface Damage • Comparison of Model with Experiments • Conclusions CMP-MIC 2006
Plastic Deformation (Plow) Brittle Fracture gives Flakes Surface Damage •Indenter = Hard Impurity Particle •Indenter Forced Into Surface •Indenter Dragged Across Surface CMP-MIC 2006
Surface Damage • ILD (PETEOS) • Failure by Brittle Fracture CMP-MIC 2006
Surface Damage • Copper • Plastic Deformation CMP-MIC 2006
Surface Damage • Copper • Plastic Deformation CMP-MIC 2006 Dp=1-2 micron
Copper CMP Copper Slurry Fumed SiO2 Abrasive Same Copper Slurry With 0.07% wgt 1.1 m -Al2O3 particles ILD CMP Copper Slurry Fumed SiO2 Abrasive Same Copper Slurry With 0.07% wgt 1.1 m -Al2O3 particles Experiments 100 mm Blanket Wafers, 60 s polishing on a Logitech CDP polisher (Logitech Ltd., Glasgow, UK) with an A110 pad with CMC standard concentric grooving (30 mils x 10 mils x 80 mils) CMP-MIC 2006
PETEOS Explosion of Brittle Fractures Copper Explosion of Surface Damage Plow Lines Rolling Indenter Experimental Results – Candela Instruments CMP-MIC 2006
Depth of Defects • AFM of Copper Surface Damage δave=9.6 nm ? δave=1.7 nm CMP-MIC 2006
Model Equations-1 • 1) Surface Damage type=i; surface material=j, • Population No./cm2 • Population Balance of Surface Damage s Removal Generation Uncovery s=/i Impurity Particles CMP-MIC 2006
Surface Damage Results Total Number density of Scratches • Evolution of the Initial Size Distribution of Scratches with time, RRo=-400 nm/s, UR=0, PR=0. Time CMP-MIC 2006
Add 0.2% Impurity Particles RRo=-400 nm/s, UR= 0, PR = - 0.002*0.2*RRo. 20% of RR is mechanical 0.2% Impurity Particles Time CMP-MIC 2006
Add Impurity Particles 2% impurity particles 0.2% impurity particles 0% impurity particles PR = (% I Particles) RRo(Fraction Mechanical Removal) RRo= -400 nm/s CMP-MIC 2006
Uncover of Pores with Scratch Production • Total Number of Scratches as a Function of Polishing Time, RRo= -400 nm/s, UR= -RRo commencing at 5 s and continuing until the 4,000 nm pores are uncovered, PR = - 0.02*0.2*RRo. w uncovery Pore w/o uncovery s s s=/i CMP-MIC 2006
Surface Damage Model Conclusions • Dynamic Population Balance Model of Scratches has been developed • With simple models for RR, PR and UR • Results are Expected • Starting with a large population of surface scratches • Low PR results in decreased number of scratches • High PR results in increased number of scratches • Uncover of pores is a temporal problem CMP-MIC 2006
Model Equations-2 • 2) Impurity Particle Population No./mL • Under Wafer Impurity Particle Population Balance Dissolution Inflow Outflow Production Removal by Grooves CMP-MIC 2006
Production Rate (ILD only) Removal Rate in Grooves Impurity Particles Particle Mass Transfer Impurity Particle Rotation The particle removal frequency, β, The collision frequency, αc, varies from 10-3 to 104 Hz β values ranging from 14 Hz to 440 Hz. CMP-MIC 2006
Size of scratch debris particles (red line) versus the size of the indenter causing the damage to the wafer surface (ILD). Pointed Particle with 1/10th radius of curvature 2 1 Evans, A.G. and Marshall, D.B. Fundamentals of Friction and Wear of Materials, (ASM: 1980), p. 441 α(s) Flake Results 1/8 s n=1 CMP-MIC 2006
Flow in Grooves Velocity Vectors for Flow of Slurry in Groove, Vrel= 1 m/s Particle Trajectories for Flow of Slurry in Groove, Vrel= 1 m/s CMP-MIC 2006
Solution for Impurity Particles • Impurity Particle Population Balance • Separation of Variables • Solve for functions individually • Initial Condition CMP-MIC 2006
Solution for Impurity Particles • Cases – Impurity Particle Equation • with particle dissolution • with particle generation • with particle removal • Flow Types • Wafer Center – Dead (Stagnant) Zone • Batch • Wafer Periphery • Well mixed • Plug flow CMP-MIC 2006
Impurity Particles - Stagnant Zone • Analytical Solutions • Stagnant Zone – dissolution + generation, n=0 • Stagnant Zone – dissolution + generation • Stagnant Zone – dissolution + generation + Groove removal CMP-MIC 2006
Stagnant Zone – dissolution Impurity Particles Plot of impurity particle population with time for the conditions, n = 0, αc = 10-4 Hz, sc= 500 nm, D = 30 nm/s, No=1/mL, so=103nm. ηI_o(s) is given by the red solid line, the population ηI(s,t) is given by all the other lines with the dotted blue line for t = 0.1 τ, the dashed green line for t = 2 τ, the dot-dash magenta line for t = 4 τ, the dotted cyan line for t = 6 τ, the dotted brown line for t = 8 τ, the dashed black line for t = 10 τ, the dot-dash red line for t = 12 τ and the solid blue line for t = 14 τ where τ = 10 s. Scratch Debris Batch-2.mcd. CMP-MIC 2006
Stagnant Zone – dissolution + generation Impurity Particles αc = 0.0001 Hz αc = 0.01 Hz Plot of impurity particle population with time for the conditions, n = 2, αc = 10-2 Hz and 10-4 Hz, sc=500 nm, D = 30 nm/s, No=1/mL, so=103nm. ηI_o(s) is given by the red solid line, the population ηI(s,t) is given by all the other lines with the dotted blue line for t = 0.1 τ, the dashed green line for t = 2 τ, the dot-dash magenta line for t = 4 τ, the dotted cyan line for t = 6 τ, the dotted brown line for t = 8 τ, the dashed black line for t = 10 τ, the dot-dash red line for t = 12 τ and the solid blue line for t = 14 τ where τ = 10 s. Scratch Debris Batch-2.mcd. CMP-MIC 2006
Stagnant Zone – dissolution + generation + groove removal αc = 0.00001 Hz =1 Hz =10 Hz Plot of groove enhanced impurity particle population with time for the conditions, β = 1 Hz (A) and 10 Hz (B), d50= 1000 nm, n = 2, αc = 10-4 Hz, sc=500nm, D = 30 nm/s, No=1/mL, so=103nm. ηI_o(s) is given by the red solid line, the population ηI(s,t) is given by all the other lines with the dotted blue line for t = 0.1 τ, the dashed green line for t = 2 τ, the dot-dash magenta line for t = 4 τ, the dotted cyan line for t = 6 τ, the dotted brown line for t = 8 τ, the dashed black line for t = 10 τ, the dot-dash red line for t = 12 τ and the solid blue line for t = 14 τ where τ = 10 s. Scratch Debris Batch-2.mcd. CMP-MIC 2006
Conclusions-Impurity Particle Model • When Impurity Particle Production Rate is Dominant • Explosion of Impurity Particles • When Impurity Particle Removal Rate is Dominant • Decreasing Population of Under Wafer Impurity Particles CMP-MIC 2006
Apply to Several Types of Surface Damage • ILD • Brittle Fracture • Copper • Plastic Plow • Rolling Indenter • One Equation for Each type of Surface Damage CMP-MIC 2006
Surface Damage • Coupled to Impurity Population Balance Removal Generation Uncovery Surface Damage type=i; surface material=j, s=/i s CMP-MIC 2006
Scratch Depth δ δ κ κ s s Particle Pressed into Pad Asperity by Wafer Surface CMP-MIC 2006
ILD Surface Damage (i=1) Surface Damage Mechanism (j) kij(s = δ/κi) κi Comment Brittle Fracture Scratching FDK.P_MT(s) 0.1 Only valid for impurity particles above a certain size Chatter Surface Damage FDK.P_RC(s)(1-(s/δgap)) >0.1 Impurity particles must be larger than the gap between wafer and pad Copper Surface Damage (i=2) Surface Damage Mechanism (j) kij (s = δ/κi) κi Comment Plastic plow surface deformation (line scratches) FDK.P_MT(s) 0.54 Only valid for impurity particles between certain sizes, the size associated with the elastic limit and the plastic yield point Rolling Indenter Particle Surface Damage FDK.P_RC(s)(s/δgap) 0.54 Impurity particles must be larger on one axis than the gap between wafer and pad Rate of Surface Damage FD is the fraction of particle collisions with the wafer surface that cause surface damage. K.P_RC(s) is the particle collision rate with wafer surface due to particle rotation. K.P_MT(s) is the particle collision rate with wafer surface due to particle mass transfer. CMP-MIC 2006
Stagnant Zone for Pad Without Grooves StagnantZone w/o Grooves CMP-MIC 2006
Stagnant Zone w Grooves CMP-MIC 2006
Peripheral (CSTR) w/o Grooves CMP-MIC 2006
Peripheral (CSTR) w Groove CMP-MIC 2006
Model Comparison • Measure the number, types and location of surface defects on a wafer polished under a given set of CMP operating conditions • Standard Slurry • Spiked with Impurity Particles CMP-MIC 2006
Conclusions • Surface Damage Mechanisms • Copper Plastic Deformation • Line Scratch & Rolling Indenter • ILD Brittle Fracture • Chatter Scratch & Brittle Fracture • Model Gives Size Distribution of Defects as it Changes with Polish Time • Slightly More Scratching in Stagnant Zone (Wafer Center) • When there is an excess of debris production compared to debris removal by either washout or removal in the pad grooves, the impurity particles will build up and cause surface damage CMP-MIC 2006
Extra Slides CMP-MIC 2006
Die Yield • N = No. metal layers • n = No. metal CMP )perations • m = No. ILD CMP Operations • o = No. Barrier CMP Operations • Pi = Probability of die failure due to CMP CMP-MIC 2006
Surface Damage at Wafer Rim • Scratching in Wafer Rim • Production Rate (BSG only) x = Rw - r x=5 micron x=50 micron x=500 micron x=5 mm Impurity Particle Rotation Across Gap CMP-MIC 2006
Wafer Rim has more Surface Damage Rim Center CMP-MIC 2006
Model Equations • Impurity Particle Population No./mL • Under Wafer Impurity Particle Population Balance • Surface Damage type=i; surface material=j, • Population No./cm2 • Population Balance of Surface Damage Dissolution Inflow Outflow Production Removal by Grooves s Removal Generation Uncovery s=/i CMP-MIC 2006
Increase Generation RateStagnant Zone – dissolution + generation + groove removal αc = 0.01 Hz =1 Hz =10 Hz Plot of groove enhanced impurity particle population with time for the conditions, β = 1 Hz (A) and 10 Hz (B), d50= 1000 nm, n = 2, αc = 10-2 Hz, sc=500nm, D = 30 nm/s, No=1/mL, so=103nm. ηI_o(s) is given by the red solid line, the population ηI(s,t) is given by all the other lines with the dotted blue line for t = 0.1 τ, the dashed green line for t = 2 τ, the dot-dash magenta line for t = 4 τ, the dotted cyan line for t = 6 τ, the dotted brown line for t = 8 τ, the dashed black line for t = 10 τ, the dot-dash red line for t = 12 τ and the solid blue line for t = 14 τ where τ = 10 s. Scratch Debris Batch-2.mcd. CMP-MIC 2006