Download

1 / 20
200 likes | 391 Views
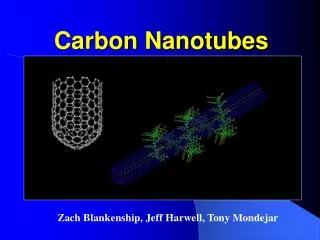
Electrical Measurement of Single Molecule Catalysis using Carbon Nanotubes. Brett Goldsmith , Alexander Kane, Vaikunth Khalap , John Coroneus , Gregory Weiss, Phil Collins Department of Physics and Astronomy University of California Irvine. Outline. Single Molecule Sensor Construction

E N D
Electrical Measurement of Single Molecule Catalysis using Carbon Nanotubes Brett Goldsmith, Alexander Kane, VaikunthKhalap, John Coroneus, Gregory Weiss, Phil Collins Department of Physics and Astronomy University of California Irvine
Outline • Single Molecule Sensor Construction • Measurement of Catalysis Reaction Rate • Dynamics of the Bound State
Single Molecule Sensors Ensemble Stochastic binding analyte absent binding analyte absent absent absent present present
Device Construction Source PMMA PMMA Drain Coroneus, et al.Chem. Phys. Chem. accepted Goldsmith, et al.Science2007, 315, 77.
The Catalysis Reaction EDC attached EDC urea + + EDC binds to the carboxyl group on the nanotube. The bound EDC perturbs the current in the nanotube. A reaction with water releases the bound EDC as a mixed urea.
Interaction With EDC Goldsmith et al.Nano Lett.,8 (1), 189 -194, 2008
Interaction With EDC Turnover Time Time Bonded Waiting Time
Single Molecule Rate Constant Turnover Time Time Bonded Waiting Time k-1= 58.9 ± 18.3 s
Bound State Lifetime Bound State Lifetime: <tbound> = 12.4 ± 2.1 s k-1= 58.9 ± 18.3 s
Energy of a Two Level System DE = kBTln(<tlo>/<thi>) ~11% of these states are very different
Energy of a Two Level System 90% 10% at experimental pH = 4.5
Summary Goldsmith, et al.Science2007, 315, 77. Goldsmith et al.Nano Lett.,8 (1), 189 -194, 2008 Goldsmith et al.JMR, accepted Coroneus, et al.Chem. Phys. Lett., accepted Dr. Phil Collins Brett Goldsmith Alex Kane Bucky Khalap Steve Hunt Danny Wan Tatyana Sheps Dr. Gregory Weiss John Coroneus ACS-PRF
Other Samples… EDC Pthalic Anhydride JMR…
Amplitude of the Two Level System The amplitude of the two groups of bound states also differs. These different bound state properties could be due to the ~10% protonated EDC in solution at our conditions.