Download
1 / 33
330 likes | 426 Views
Explore the evolution of man-made CO2 emissions worldwide from 1965 to 2012. Analyze emissions growth, policies, and the impact on different nations and regions. Understand the shift from developed to developing nations in CO2 production.

E N D
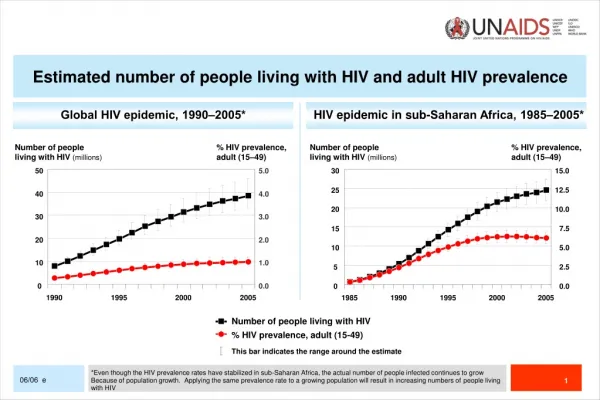
Man-made CO2 emissions 1965 – 2012source data provided by BP June 2013 Man-made CO2 emissions 1965 - 2012
Man-made CO2 emissions 1965 -2012 The following calculations and graphics are based on information on national CO2 emission levels worldwide published by BP in June 2013 for the period from 1965 up until 2012. The data is well corroborated by previous datasets published by the Guardian and Google up until 2009. Man-made CO2 emissions 1965 -2012
Man-made CO2 emissions 1965 -2012 • A logical grouping of nations with regard to attitudes to CO2 emissions control is used. It is as follows: • The European Union, (including the UK), believers in action to combat Global Warming. • United States of America. • Japan, the former Soviet Union, Canada and Australia are developed nations, ignoring Kyoto. • Korea, Iran, South Africa, Mexico, Saudi Arabia, Brazil, Indonesia and Taiwan: developing rapidly. • China and Hong Kong: developing rapidly. • India: developing rapidly. • Rest of World (~160 Nations): developing rapidly. Man-made CO2 emissions 1965 - 2012
Man-made CO2 emissions 1965 -2012 Man-made CO2 emissions 1965 - 2012
Current CO2 emissions Nations grouped according to CO2 emissions policies CO2 2012 pop 2012 CO2/head Committed EU (27) 11.5% 7.2% 7.9 Not Joining-in USA ? 16.8% 4.5% 18.3 RU JP CA AU 13.4% 4.3% 15.1 China 27.0% 19.1% 6.9 India 5.3% 17.3% 1.5 KR IR ZA MX SA BR ID TW 12.3% 10.7% 5.4 Rest of World (160+ Nations) 13.7% 36.3% 1.8 World Average 4.9 Man-made CO2 emissions 1965 - 2012
CO2 emissions growth 1965 - 2012 Man-made CO2 emissions 1965 - 2012
CO2 emissions growth 1965 - 2012 Man-made CO2 emissions 1965 - 2012
CO2 emissions growth 1965 - 2012 Man-made CO2 emissions 1965 - 2012
CO2 emissions growth 1965 - 2012 Man-made CO2 emissions 1965 - 2012
Man-made CO2 emissions 1965 -2012 • These graphs of total CO2 emission history show that up until 2012: • CO2 emissions from the developing world as a whole overtook the developed world in 2007 and are now ~42% higher. • there has been a very rapid escalation of Chinese CO2 emissions since the year 2000. • China overtook the USA CO2 emissions in 2006, and by 2012 Chinese emissions were already ~60% greater than the USA, and that growth will continue. • there is inexorable emissions growth from all the developing economies, from a low base. Man-made CO2 emissions 1965 - 2012
Man-made CO2 emissions 1965 -2012 • These graphs of total CO2 emission history show that up until 2012: • India has accelerating emissions, growing substantially, from a low base. • The stabilisation or reduction of emissions from developed economies. The USA, simply by exploiting shale gas for electricity generation, has already reduced its CO2 emissions by some 8% in the last year. That alone has already had more CO2 emission reduction effect than the entire Kyoto protocol. • any CO2 emissions reduction made by the Developed Nations will be negated by increases from Developing Nations. Man-made CO2 emissions 1965 - 2012
CO2 emissions growth 1965 - 2012 Man-made CO2 emissions 1965 - 2012
CO2 emissions growth 1965 - 2012 Man-made CO2 emissions 1965 - 2012
CO2 emissions / head Man-made CO2 emissions 1965 - 2012
Developed / developing Nations 1965 - 2012 Man-made CO2 emissions 1965 - 2012
Man-made CO2 emissions/head 2012 • The EU(27) even with active legal measures have maintained a fairly level CO2 emission rate but have managed to reduce their CO2 emissions per head by ~29% since their peak in 1977. The recent downward trend is attributed to their declining economies. • The USA has already reduced its CO2 emissions/head by ~32% since its peak in 1970 • Russia, Japan, Canada and Australia reduced their emissions/head by ~17% since their peak in 1989 • The eight rapidly developing nations have shown consistent growth from a low base in 1965 at 5.6 times. They exceeded the world average level in 1997 Man-made CO2 emissions 1965 - 2012
Man-made CO2 emissions/head 2012 • China’s CO2 emissions/head have grown a further 140% since 2000. China overtook the world-wide average in 2003 and passed the rapidly developing nations in 2005. • India’s CO2 emissions have grown by 4.7 times over the period and are now showing recent modest acceleration. That rate is likely to grow substantially. • The Rest of the World (~160 Nations), 36% of world population have grown CO2 emissions consistently but only by 2.6 times in the period, this group will be the likely origin of major future emissions growth. • Overall average world-wide emissions/head have remained relatively steady but with early growth in the decade from 1965. It amounts to 1.6 times since 1965. Man-made CO2 emissions 1965 - 2012
CO2 emissions growth: 1965+ Man-made CO2 emissions 1965 - 2012
CO2 emissions growth: 2000+ Man-made CO2 emissions 1965 - 2012
CO2 emissions/ head Man-made CO2 emissions 1965 - 2012
CO2 emissions/head in Europe Man-made CO2 emissions 1965 - 2012
Man-made CO2 emissions 1965 -2012 • Chinese CO2 emissions at 6.7mt/head for its 1.3 billion population are already ~41% greater than the worldwide average and are still growing fast. • At 5.4mt/head, France, with ~80% nuclear electricity generation, has the lowest CO2. emission rates in the developed world and is at only ~12% above the world-wide average. • China’s CO2 emissions/head exceeded France’s CO2 emissions/head in 2009. Man-made CO2 emissions 1965 - 2012
Man-made CO2 emissions 1965 -2012 • The UK at 7.2mt/head is only ~50% higher than the world-wide average and only about ~12% higher than China. • Germany, one of the largest CO2 emitters in Europe, has emissions/head ~100% higher than the worldwide average and is still ~63% higher than China. Man-made CO2 emissions 1965 - 2012
Man-made CO2 emissions 1965 -2012 If CO2 emissions really were a concern to arrest Catastrophic Anthropogenic Global Warming / Man-made Climate Change, these comparisons show starkly the real advantage of using Nuclear power for electricity generation. This must question the Green attitudes in opposing Nuclear power. Following Fukushima, the German government position of eliminating nuclear power in a country with no earthquake risk and no chance of tsunamis is or should be untenable. Man-made CO2 emissions 1965 - 2012
Man-made CO2 emissions 1965 -2012 • In October 2010 Professor Richard Muller made the dilemma for all those who hope to control global warming by reducing CO2 emissions clear: in essence he said: • “the Developing World is not joining-in with CO2 emission reductions nor does it have any intention of doing so. The failure of worldwide action negates the unilateral action of any individual Nation”. Man-made CO2 emissions 1965 - 2012
Man-made CO2 emissions 1965 -2012 Man-made CO2 emissions 1965 - 2012
Man-made CO2 emissions 1965 -2012 Professor Fritz Vahrenholt again re-emphasised this point in a July 2012 lecture at the Royal Society. Professor Vahrenholt had pioneered the Germany’s significant advance in renewable energy, especially in the development of wind power. He had previously accepted the IPCC as the foundation of his understanding of mankind’s effect on climate change. However, as a trained chemist he re-examined IPCC reports in detail. He found many errors, inconsistencies and unsupported assertions. He has now entirely revised his position. Man-made CO2 emissions 1965 -2012
Man-made CO2 emissions 1965 -2012 His diagram below shows the miniscule effect of the enormously costly efforts at decarbonisation in Germany, (die Energiewende), in comparison with the escalation of CO2 emissions from the rest of the world. The underdeveloped nations are bound to become progressively more industrialised and more intensive users of fossil fuels to power their development and widen their distribution of electricity. Man-made CO2 emissions 1965 -2012
Fritz Vahrenholt at Royal Society June 2012The impact of CO2 reduction policies in Germany Man-made CO2 emissions 1965 -2012
Man-made CO2 emissions 1965 -2012 The futility of the expenditure of vast resources on Green activities in Germany thus becomes clear. German actions with increasing risks to its energy security and the risk to the German economy as a whole, could only ever reduce Germany’s CO2 emissions by ~150,000,000 tonnes between 2006 and 2030. That only amounts to ~1/100 of the concomitant growth in other CO2 emissions from the developing world. Man-made CO2 emissions 1965 -2012
European CO2 emissions / China - India Man-made CO2 emissions 1965 - 2012
European CO2 emissions / China - India Man-made CO2 emissions 1965 - 2012
Man-made CO2 emissions 1965 -2012 • Professor Varhenholt is now convinced that it is nature and in particular the behaviour of the sun that is responsible for continually changing climate, and as he said as the final point of his lecture: • “This change can only develop first with a revolution of our minds.” • “It's not mankind creating climate, it’s the sun stupid.” Man-made CO2 emissions 1965 -2012