eHARS Dashboard: A Comprehensive Tool for Monitoring HIV Surveillance Activities
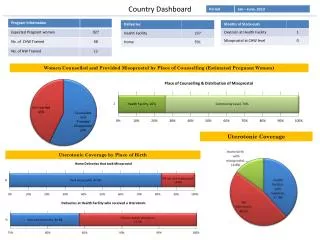
The eHARS Dashboard is an innovative tool designed to enhance HIV surveillance activities. It integrates multiple data sources, requiring complete and accurate data while adapting to changing procedures. The system supports both passive and active surveillance through electronic data handling, ensuring thorough evaluation and response to emerging trends and gaps. The dashboard offers a user-friendly, HTML-based graphical presentation of data, allowing detailed drill-downs for specific insights. It monitors new HIV/AIDS cases and incorporates demographic trends, with monthly updates to aid public health decision-making.

eHARS Dashboard: A Comprehensive Tool for Monitoring HIV Surveillance Activities
E N D
Presentation Transcript
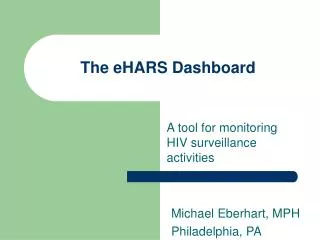
The eHARS Dashboard A tool for monitoring HIV surveillance activities Michael Eberhart, MPH Philadelphia, PA
HIV Surveillance • Requires complete and accurate data • Multiple sources • Various report mechanisms • Changing procedures/requirements • Passive and active surveillance • Electronic data • Parsing/cleaning/importing
HIV Surveillance • Frequent evaluation and review • Respond to subtle changes • Identify gaps • Compare with historical trends • Not just cases • Facilities • Labs • Physicians • Completeness • Workflow
eHARS Data • Person dataset • New cases and demographic trends • Document dataset • Report sources and methods • Laboratory tests • Death reports • TTH (for incidence surveillance)
eHARS Dashboard • Data “at a glance” • Succinct presentation • Actionable data • Trends • Comparisons • Identify new issues • Modified from sample code • “Information Dashboard Design” by Stephen Few
eHARS Dashboard • Produced monthly • HTML-based • Graphical presentation • Drill-down to more detailed information • Overview of all activities • User-specific information in the background
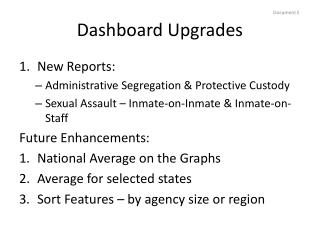
eHARS Dashboard - Components • Documents • Entered manually • Total docs • By user • By type • Completeness • Missing Surveillance Method • Missing Report Source • Missing Report Medium
eHARS Dashboard - Components • Documents • Imported electronically • Total docs • By user • By type
eHARS Dashboard - Components • New HIV/AIDS Cases • Past 12 months • Compared to previous 12 months
eHARS Dashboard - Components • Cumulative Data • Total reported AIDS • Total reported HIV • Total reported perinatal exposures • Median time to data entry • This period/Last period
eHARS Dashboard - Components • Top 10 Diagnosing Facilities • Past 90 days • Drill down to complete list • Exclude private • Drill-down to list of cases with missing data • Lab import issue
eHARS Dashboard - Components • Median Initial CD4 • Boxplot w/ confidence intervals • Cases dx’d in previous 6 months • Comparison by gender • Race • Mode of Exposure • Public/private
eHARS Dashboard - Components • Open Cases by Investigator • Uses local fields • Compare staff • Monitor workload • Drill-down to lists
eHARS Dashboard - Components • Completed cases by Investigator • Compare staff • Compare to unit average • Monitor workload • Drill-down to summary data
eHARS Dashboard - Components • Electronic Lab Reporting • Past 12 months • Compared to previous 12 months • Drill-down to lab-specific trends • Listing by month and lab • Graphs of 2-year trends
eHARS Dashboard - Components • Reported Labs by Type • CD4 • Western Blot • Viral Load • Other • Last complete month compared to monthly average
eHARS Dashboard - Components • Process indicators – Past 90 days • % NIR • % Missing Race/ethnicity • % No CD4 (Count or percent) • % Missing Vital Status • % Invalid address • Local interest…
eHARS Dashboard – SAS Code • Intermediate level • Working with macro variables • Proc SQL • SAS/GRAPH • Templates, GREPLAY, Device options • ODS • HTML (drill-down and tool tips)
eHARS Dashboard • Demo • Questions?
Thank You! • Contact Information • michael.eberhart@phila.gov