Chapter 9: Phase Diagrams
360 likes | 685 Views
Chapter 9: Phase Diagrams. ISSUES TO ADDRESS. • When we combine two elements... what equilibrium state do we get?. • In particular, if we specify... --a composition (e.g., wt% Cu - wt% Ni), and --a temperature ( T ). then... How many phases do we get?

Chapter 9: Phase Diagrams
E N D
Presentation Transcript
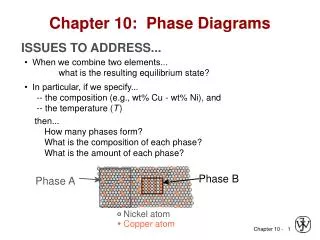
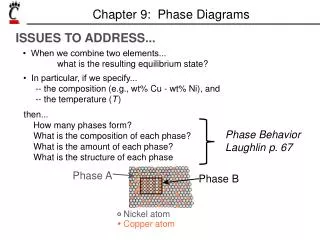
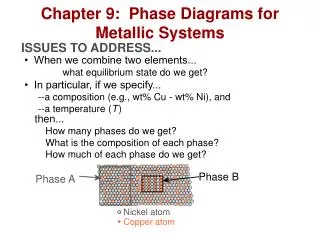
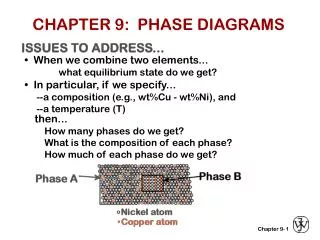
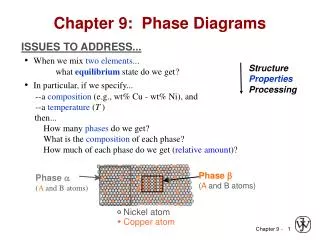
Chapter 9: Phase Diagrams ISSUES TO ADDRESS... • When we combine two elements... what equilibrium state do we get? • In particular, if we specify... --a composition (e.g., wt% Cu - wt% Ni), and --a temperature (T) then... How many phases do we get? What is the composition of each phase? How much of each phase do we get? Phase B Phase A Nickel atom Copper atom
Sucrose/Water Phase Diagram 10 0 Solubility L Limit 8 0 (liquid) 6 0 + L Temperature (°C) S (liquid solution 4 0 i.e., syrup) (solid 20 sugar) 0 20 40 60 80 100 65 Co =Composition (wt% sugar) Sugar Water Pure Pure Phase Equilibria: Solubility Limit • Introduction • Solutions – solid solutions, single phase • Mixtures – more than one phase Adapted from Fig. 9.1, Callister 7e. • Solubility Limit: Max concentration for which only a single phase solution occurs. Question: What is the solubility limit at 20°C? Answer: 65 wt% sugar. If Co < 65 wt% sugar: syrup If Co > 65 wt% sugar: syrup + sugar.
Components and Phases • Components: The elements or compounds which are present in the mixture (e.g., Al and Cu) • Phases: The physically and chemically distinct material regions that result (e.g., a and b). Aluminum- Copper Alloy b (lighter phase) a (darker phase) Adapted from chapter-opening photograph, Chapter 9, Callister 3e.
B (100°C,70) 1 phase D (100°C,90) 2 phases 100 L 80 (liquid) + 60 L S Temperature (°C) ( liquid solution (solid 40 i.e., syrup) sugar) A (20°C,70) 2 phases 20 0 0 20 40 60 70 80 100 Co =Composition (wt% sugar) Effect of T & Composition (Co) path A to B. • Changing T can change # of phases: • Changing Co can change # of phases: path B to D. water- sugar system Adapted from Fig. 9.1, Callister 7e.
Phase Equilibria Simple solution system (e.g., Ni-Cu solution) • Both have the same crystal structure (FCC) and have similar electronegativities and atomic radii (W. Hume – Rothery rules) suggesting high mutual solubility. • Ni and Cu are totally miscible in all proportions.
T(°C) • 2 phases: 1600 L (liquid) 1500 L (liquid) a (FCC solid solution) • 3 phase fields: 1400 L a liquidus + 1300 a L + L solidus a a 1200 (FCC solid 1100 solution) 1000 wt% Ni 0 20 40 60 80 100 Phase Diagrams • Indicate phases as function of T, Co, and P. • For this course: -binary systems: just 2 components. -independent variables: T and Co (P = 1 atm is almost always used). •Phase Diagram for Cu-Ni system Adapted from Fig. 9.3(a), Callister 7e. (Fig. 9.3(a) is adapted from Phase Diagrams of Binary Nickel Alloys, P. Nash (Ed.), ASM International, Materials Park, OH (1991).
T(°C) 1600 L (liquid) 1500 a 1 phase: Cu-Ni phase diagram liquidus B (1250°C, 35): (1250°C,35) 1400 solidus a 2 phases: L + a a + 1300 L B (FCC solid 1200 solution) 1100 A(1100°C,60) 1000 wt% Ni 0 20 40 60 80 100 Phase Diagrams:# and types of phases • Rule 1: If we know T and Co, then we know: --the # and types of phases present. • Examples: A(1100°C, 60): Adapted from Fig. 9.3(a), Callister 7e. (Fig. 9.3(a) is adapted from Phase Diagrams of Binary Nickel Alloys, P. Nash (Ed.), ASM International, Materials Park, OH, 1991).
Cu-Ni system T(°C) A T C = 35 wt% Ni A o tie line liquidus L (liquid) At T = 1320°C: 1300 A a + L Only Liquid (L) B T solidus B C = C ( = 35 wt% Ni) L o a a At T = 1190°C: + D L (solid) 1200 D a Only Solid ( ) T D C = C ( = 35 wt% Ni ) a o 32 35 4 3 20 30 40 50 At T = 1250°C: C C C a B L o wt% Ni a Both and L C = C ( = 32 wt% Ni here) L liquidus C = C ( = 43 wt% Ni here) a solidus Phase Diagrams:composition of phases • Rule 2: If we know T and Co, then we know: --the composition of each phase. • Examples: Adapted from Fig. 9.3(b), Callister 7e. (Fig. 9.3(b) is adapted from Phase Diagrams of Binary Nickel Alloys, P. Nash (Ed.), ASM International, Materials Park, OH, 1991.)
Phase Diagrams:weight fractions of phases Cu-Ni system T(°C) A T C = 35 wt% Ni A o tie line liquidus L (liquid) At T : Only Liquid (L) 1300 a A + L B W = 100 wt%, W = 0 a L T solidus B S R a At T : Only Solid ( ) D a a + W = 0, W = 100 wt% L a L (solid) 1200 D T a D At T : Both and L B 32 35 4 3 20 3 0 4 0 5 0 S = WL C C C a L o wt% Ni R + S R = = 27 wt% Wa R + S • Rule 3: If we know T and Co, then we know: --the amount of each phase (given in wt%). • Examples: Adapted from Fig. 9.3(b), Callister 7e. (Fig. 9.3(b) is adapted from Phase Diagrams of Binary Nickel Alloys, P. Nash (Ed.), ASM International, Materials Park, OH, 1991.)
T(°C) tie line liquidus L (liquid) 1300 a + M ML L B solidus T B a a + L (solid) 1200 R S S R 20 3 0 4 0 5 0 C C C a L o wt% Ni The Lever Rule • Tie line – connects the phases in equilibrium with each other - essentially an isotherm • How much of each phase? Think of it as a lever (teeter-totter) Adapted from Fig. 9.3(b), Callister 7e.
Ex: Cooling in a Cu-Ni Binary T(°C) L: 35wt%Ni L (liquid) Cu-Ni system a 130 0 A + L L: 35 wt% Ni B a: 46 wt% Ni 35 46 C 32 43 D L: 32 wt% Ni 24 36 a a : 43 wt% Ni + 120 0 E L L: 24 wt% Ni a : 36 wt% Ni a (solid) 110 0 35 20 3 0 4 0 5 0 wt% Ni C o • Phase diagram: Cu-Ni system. • System is: --binary i.e., 2 components: Cu and Ni. --isomorphous i.e., complete solubility of one component in another; a phase field extends from 0 to 100 wt% Ni. • Consider Co = 35 wt%Ni. Adapted from Fig. 9.4, Callister 7e.
Cored vs Equilibrium Phases Uniform C : a a First to solidify: 35 wt% Ni 46 wt% Ni a Last to solidify: < 35 wt% Ni • Ca changes as we solidify. • Cu-Ni case: First a to solidify has Ca = 46 wt% Ni. Last a to solidify has Ca = 35 wt% Ni. • Fast rate of cooling: Cored structure • Slow rate of cooling: Equilibrium structure
60 %EL for pure Cu 400 %EL for 50 pure Ni TS for Elongation (%EL) 40 pure Ni Tensile Strength (MPa) 300 30 TS for pure Cu 200 20 0 20 40 60 80 100 0 20 40 60 80 100 Cu Ni Cu Ni Composition, wt% Ni Composition, wt% Ni Mechanical Properties:Cu-Ni System • Effect of solid solution strengthening on: --Tensile strength (TS) --Ductility (%EL,%AR) Adapted from Fig. 9.6(a), Callister 7e. Adapted from Fig. 9.6(b), Callister 7e. --Peak as a function of Co --Min. as a function of Co
Binary-Eutectic Systems • Eutectic transition L(CE) (CE) + (CE) has a special composition with a min. melting T. 2 components Cu-Ag system T(°C) Ex.: Cu-Ag system 1200 • 3 single phase regions L (liquid) a, b (L, ) 1000 a L + a • Limited solubility: b L + 779°C b 800 TE a : mostly Cu 8.0 71.9 91.2 b : mostly Ag 600 • TE : No liquid below TE a + b 400 • CE : Min. melting TE composition 200 80 100 0 20 40 60 CE Co , wt% Ag Adapted from Fig. 9.7, Callister 7e.
EX: Pb-Sn Eutectic System (1) T(°C) 300 L (liquid) a L + a b b L + 200 183°C 18.3 61.9 97.8 C- CO 150 S R S = W = a R+S C- C 100 a + b 99 - 40 59 = = = 67 wt% 99 - 11 88 100 0 11 20 60 80 99 40 CO - C R W C C Co = = C, wt% Sn C - C R+S 40 - 11 29 = = 33 wt% = 99 - 11 88 • For a 40 wt% Sn-60 wt% Pb alloy at 150°C, find... --the phases present: a + b Pb-Sn system --compositions of phases: CO = 40 wt% Sn Ca = 11 wt% Sn Cb = 99 wt% Sn --the relative amount of each phase: Adapted from Fig. 9.8, Callister 7e.
EX: Pb-Sn Eutectic System (2) T(°C) CL - CO 46 - 40 = W = a CL - C 46 - 17 300 L (liquid) 6 a L + = = 21 wt% 29 220 a b b R L + S 200 183°C 100 a + b 100 17 46 0 20 40 60 80 C CL Co C, wt% Sn CO - C 23 = W = = 79 wt% L CL - C 29 • For a 40 wt% Sn-60 wt% Pb alloy at 200°C, find... --the phases present: a + L Pb-Sn system --compositions of phases: CO = 40 wt% Sn Ca = 17 wt% Sn CL = 46 wt% Sn --the relative amount of each phase: Adapted from Fig. 9.8, Callister 7e.
Microstructures in Eutectic Systems: I T(°C) L: Cowt% Sn 400 L a L 300 L a + a 200 (Pb-Sn a: Cowt% Sn TE System) 100 b + a 0 10 20 30 Co , wt% Sn Co 2 (room T solubility limit) • Co < 2 wt% Sn • Result: --at extreme ends --polycrystal of a grains i.e., only one solid phase. Adapted from Fig. 9.11, Callister 7e.
Microstructures in Eutectic Systems: II L: Co wt% Sn T(°C) 400 L L 300 a L + a a: Cowt% Sn a 200 TE a b 100 b + a Pb-Sn system 0 10 20 30 Co , wt% Sn Co 2 (sol. limit at T ) 18.3 room (sol. limit at TE) • • 2 wt% Sn < Co < 18.3 wt% Sn • • Result: • Initially liquid + • then alone • finally two phases • a polycrystal • fine -phase inclusions Adapted from Fig. 9.12, Callister 7e.
Microstructures in Eutectic Systems: III Micrograph of Pb-Sn T(°C) eutectic L: Co wt% Sn microstructure 300 L Pb-Sn system a L + a b L 200 183°C TE 100 160m a : 97.8 wt% Sn Adapted from Fig. 9.14, Callister 7e. : 18.3 wt%Sn 0 20 40 60 80 100 97.8 18.3 CE C, wt% Sn 61.9 • Co = CE • Result: Eutectic microstructure (lamellar structure) --alternating layers (lamellae) of a and b crystals. Adapted from Fig. 9.13, Callister 7e.
Lamellar Eutectic Structure Adapted from Figs. 9.14 & 9.15, Callister 7e.
Microstructures in Eutectic Systems: IV • Just above TE : L T(°C) L: Co wt% Sn a C = 18.3 wt% Sn a L a CL = 61.9 wt% Sn 300 L Pb-Sn system S W a L + a = 50 wt% = R + S a b WL = (1- W ) = 50 wt% b L + a R S 200 TE S R • Just below TE : C = 18.3 wt% Sn a a b 100 + a primary C = 97.8 wt% Sn b a eutectic S b eutectic W a = 73 wt% = R + S 0 20 40 60 80 100 W = 27 wt% b 18.3 61.9 97.8 Adapted from Fig. 9.16, Callister 7e. Co, wt% Sn • 18.3 wt% Sn < Co < 61.9 wt% Sn • Result:a crystals and a eutectic microstructure
Hypoeutectic & Hypereutectic hypoeutectic: Co = 50 wt% Sn hypereutectic: (illustration only) (Figs. 9.14 and 9.17 from Metals Handbook, 9th ed., Vol. 9, Metallography and Microstructures, American Society for Metals, Materials Park, OH, 1985.) a b a b a a b b a b a b 175 mm Adapted from Fig. 9.17, Callister 7e. Adapted from Fig. 9.17, Callister 7e. (Illustration only) 300 L T(°C) Adapted from Fig. 9.8, Callister 7e. (Fig. 9.8 adapted from Binary Phase Diagrams, 2nd ed., Vol. 3, T.B. Massalski (Editor-in-Chief), ASM International, Materials Park, OH, 1990.) a L + a b b L + (Pb-Sn 200 TE System) a + b 100 Co, wt% Sn 0 20 40 60 80 100 eutectic 61.9 eutectic: Co=61.9wt% Sn 160 mm eutectic micro-constituent Adapted from Fig. 9.14, Callister 7e.
Intermetallic Compounds Adapted from Fig. 9.20, Callister 7e. Mg2Pb Note: intermetallic compound forms a line - not an area - because stoichiometry (i.e. composition) is exact.
cool cool cool heat heat heat • Eutectoid - solid phase in equation with two solid phases • S2S1+S3 • + Fe3C (727ºC) intermetallic compound - cementite • Peritectic - liquid + solid 1 solid 2 (Fig 9.21) • S1 + LS2 • + L (1493ºC) Eutectoid & Peritectic • Eutectic - liquid in equilibrium with two solids L +
Peritectic transition + L Eutectoid transition + Eutectoid & Peritectic Cu-Zn Phase diagram Adapted from Fig. 9.21, Callister 7e.
T(°C) 1600 d -Eutectic (A): L 1400 Þ g + L Fe3C g +L g A 1200 L+Fe3C 1148°C -Eutectoid (B): (austenite) R S g Þ a + Fe3C g g 1000 g +Fe3C g g a Fe3C (cementite) + 800 B g a 727°C = T eutectoid R S 600 a +Fe3C 400 0 1 2 3 4 5 6 6.7 4.30 0.76 Co, wt% C (Fe) 120 mm Fe3C (cementite-hard) Result: Pearlite = alternating layers of eutectoid a (ferrite-soft) a and Fe3C phases (Adapted from Fig. 9.27, Callister 7e.) Adapted from Fig. 9.24,Callister 7e. C Iron-Carbon (Fe-C) Phase Diagram • 2 important points
T(°C) 1600 d L 1400 (Fe-C g +L g g g System) 1200 L+Fe3C 1148°C (austenite) g g g 1000 g g +Fe3C g g Fe3C (cementite) r s 800 a g g 727°C a a a g g R S 600 a +Fe3C w = s /( r + s ) a w = (1- w ) g a 400 0 1 2 3 4 5 6 6.7 a Co, wt% C (Fe) C0 0.76 pearlite w = w g pearlite Hypoeutectoid 100 mm w = S /( R + S ) a steel w = (1- w ) a Fe3C pearlite proeutectoid ferrite Adapted from Fig. 9.30,Callister 7e. Hypoeutectoid Steel Adapted from Figs. 9.24 and 9.29,Callister 7e. (Fig. 9.24 adapted from Binary Alloy Phase Diagrams, 2nd ed., Vol. 1, T.B. Massalski (Ed.-in-Chief), ASM International, Materials Park, OH, 1990.)
T(°C) 1600 d L 1400 (Fe-C g +L g g g System) 1200 L+Fe3C 1148°C g g (austenite) g 1000 g g +Fe3C g g Fe3C (cementite) Fe3C s r 800 g g a g g R S 600 a +Fe3C w = r /( r + s ) Fe3C w =(1- w ) g Fe3C 400 0 1 2 3 4 5 6 6.7 Co, wt%C (Fe) pearlite w = w g pearlite w = S /( R + S ) a Hypereutectoid 60mm steel w = (1- w ) a Fe3C pearlite proeutectoid Fe3C Adapted from Fig. 9.33,Callister 7e. Hypereutectoid Steel Adapted from Figs. 9.24 and 9.32,Callister 7e. (Fig. 9.24 adapted from Binary Alloy Phase Diagrams, 2nd ed., Vol. 1, T.B. Massalski (Ed.-in-Chief), ASM International, Materials Park, OH, 1990.) Co 0.76
Example: Phase Equilibria For a 99.6 wt% Fe-0.40 wt% C at a temperature just below the eutectoid, determine the following • composition of Fe3C and ferrite () • the amount of carbide (cementite) in grams that forms per 100 g of steel • the amount of pearlite and proeutectoid ferrite ()
CO = 0.40 wt% CCa = 0.022 wt% CCFe C = 6.70 wt% C 3 1600 d L 1400 T(°C) g +L g 1200 L+Fe3C 1148°C (austenite) 1000 g +Fe3C Fe3C (cementite) 800 727°C R S 600 a +Fe3C 400 0 1 2 3 4 5 6 6.7 CO C Co, wt% C CFe C 3 Chapter 9 – Phase Equilibria a) composition of Fe3C and ferrite () Solution: • the amount of carbide (cementite) in grams that forms per 100 g of steel
1600 d L 1400 T(°C) g +L g 1200 L+Fe3C 1148°C (austenite) 1000 g +Fe3C Fe3C (cementite) 800 727°C R S pearlite = 51.2 gproeutectoid = 48.8 g 600 a +Fe3C 400 CO 0 1 2 3 4 5 6 6.7 C C Co, wt% C Chapter 9 – Phase Equilibria • the amount of pearlite and proeutectoid ferrite () note: amount of pearlite = amount of g just above TE Co = 0.40 wt% CCa = 0.022 wt% CCpearlite = C = 0.76 wt% C
• Teutectoid changes: • Ceutectoid changes: (wt%C) Ti Si Mo (°C) Ni W Cr Cr eutectoid Eutectoid Si Mn W Mn Ti Mo C T Ni wt. % of alloying elements wt. % of alloying elements Adapted from Fig. 9.34,Callister 7e. (Fig. 9.34 from Edgar C. Bain, Functions of the Alloying Elements in Steel, American Society for Metals, 1939, p. 127.) Adapted from Fig. 9.35,Callister 7e. (Fig. 9.35 from Edgar C. Bain, Functions of the Alloying Elements in Steel, American Society for Metals, 1939, p. 127.) Alloying Steel with More Elements
Summary • Phase diagrams are useful tools to determine: --the number and types of phases, --the wt% of each phase, --and the composition of each phase for a given T and composition of the system. • Alloying to produce a solid solution usually --increases the tensile strength (TS) --decreases the ductility. • Binary eutectics and binary eutectoids allow for a range of microstructures.
ANNOUNCEMENTS Reading: Core Problems: Self-help Problems: