Enhancing Lightning Detection and Forecasting through GLM Algorithms and Proxy Datasets
This paper discusses the advancements in the Geostationary Lightning Mapper (GLM), focusing on the Lightning Cluster-Filter Algorithm for improved data error handling and latency reduction. It introduces a new nested tracking approach that mitigates slow-speed bias associated with atmospheric motion vectors, enhancing severe weather warning lead time. Additionally, it covers the development of proxy datasets and the Microburst Windspeed Potential Index algorithm, which accurately assesses wind gust potential, ensuring better weather forecasting and safety measures.

Enhancing Lightning Detection and Forecasting through GLM Algorithms and Proxy Datasets
E N D
Presentation Transcript
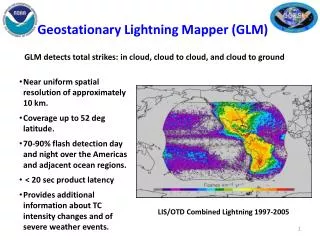
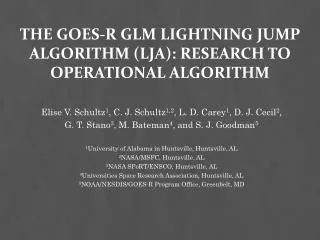
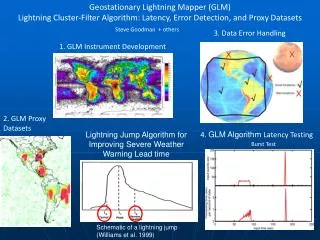
Geostationary Lightning Mapper (GLM) Lightning Cluster-Filter Algorithm: Latency, Error Detection, and Proxy Datasets Steve Goodman + others 3. Data Error Handling 1. GLM Instrument Development 2. GLM Proxy Datasets Lightning Jump Algorithm for Improving Severe WeatherWarning Lead time 4. GLM Algorithm Latency Testing Burst Test Schematic of a lightning jump (Williams et al. 1999)
A Nested Tracking Approach for Reducing the Slow Speed Bias Associated with Atmospheric Motion Vectors (AMVs) Wayne Bresky1 and Jaime M. Daniels2 IM Systems Group (IMSG), Inc.1 NOAA/NESDIS, Center for Satellite Applications and Research (STAR)2 0 • Abstract • Highlights work done to better understand and characterize the slow speed bias commonly associated with mid and upper level satellite-derived wind estimates • Introduces a new nested tracking approach which is shown to significantly reduce this slow speed bias • Results from case studies involving use of Meteosat-8 rapid-scan SEVIRI imagery are shown motion of 5x5 box motion of 15x15 box new approach
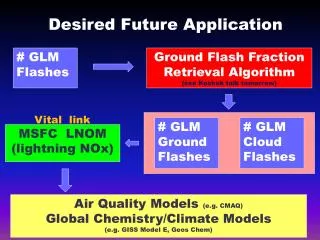
Microburst windspeed potential assessment: progress and recent developmentsKenneth L. Pryor The GOES-sounder derived microburst products diagnose wind gust potential based on conceptual models of prototype environmental profiles. A prototype microburst sounding profile includes large CAPE and a well-developed mixed layer. The Microburst Windspeed Potential Index (MWPI) algorithm incorporates CAPE, temperature lapse rate, and the relative humidity gradient (dew point depression difference) between the storm cloud base and the sub-cloud layer to model this prototype profile. Validation during the 2007-2009 convective seasons indicated a strong correlation between MWPI values and observed surface downburst wind gusts.
A flight icing threat algorithm for GOES-RWilliam L. Smith Jr., Patrick Minnis, Doug Spangenberg Aircraft icing threat determined from ABI cloud products (i.e. phase, temperature, liquid water path, and effective radius) Nov. 8, 2008 1745 UTC Icing Mask Verified by Icing PIREPS Icing Possible None Unknown PIREPS Icing Intensity Flight Icing Threat from GOES-11,12 Multichannel-RGB
Validation with MODIS (example 13th June 2008) Cloud particle size Cloud optical thickness Cloud PropertiesAndy Heidinger and Michael Pavolonis MODIS MYD06 and MOD06 products are well tested and validated data set. 5 5 5
Use of Spectral Information The goal is to isolate the cloud microphysical signal in the measured radiances such that it can be directly related to particle distributions via the single scatter properties. Sensitive to: Composition Particle size Particle shape Good separation between water and ice over most Reff Cloud phase relationship derived from single scatter properties
Algorithm Results Derivation of cloud phase from cloud type • Liquid water phase = Liquid water type • Supercooled water phase = Supercooled water type • Mixed phase = Mixed type • Ice phase = Thin ice type or Thick ice type or Multilayered ice type Water, Supercooled Water, Mixed Phase, Ice
ABI Cloud Height Algorithm MODIS Cloud Pressure Validation • MYD06 provides cloud height using a CO2 slicing approach that has been well-characterized. • The image on the right shows a comparison of the ACH run on SEVIRI compared to MODIS results for simultaneously observed pixels. • Bias = -24 hPa • Standard Deviation = 80 hPa • These stats are computed for all pixels - not just thick low clouds.
ABI Cloud Height Algorithm MODIS Cloud Temperature Validation • MYD06 provides cloud height using a CO2 slicing approach that has been well-characterized. • The image on the right shows a comparison of the ACH run on SEVIRI compared to MODIS results for simultaneously observed pixels. • Bias = -3.6 K • Standard Deviation = 9 K
A flight icing threat algorithm for GOES-RWilliam L. Smith Jr., Patrick Minnis, Doug Spangenberg Aircraft icing threat determined from ABI cloud products (i.e. phase, temperature, liquid water path, and effective radius) Nov. 8, 2008 1745 UTC Icing Mask Verified by Icing PIREPS Icing Possible None Unknown PIREPS Icing Intensity Flight Icing Threat from GOES-11,12 Multichannel-RGB
The GOES-R Rainfall Probability AlgorithmR. J. Kuligowski and J. C. Davenport Requirement: forecast probability of rainfall exceeding 0.25 mm during the next 3h, covering 60°S to 60°N within 70° LZA at the full ABI resolution every 15 min No current real-time satellite-based rainfall probability algorithms, so had to develop “from scratch” Developed using SEVIRI data from 1-5 Jan, April, July, Oct 2005 Tested on SEVIRI data for 6-9 April, July, Oct 2005 Validated against NIMROD radar over western Europe (example on right with NIMROD rain area on top) 11
The GOES-R Rainfall Potential AlgorithmR. J. Kuligowski, V. Lakshmanan, and J. C. Davenport Requirement: 0-3 h forecast of rainfall accumulation covering 60°S to 60°N within 70° LZA at the full ABI resolution every 15 min Based on K-Means algorithm developed at NOAA / OAR / NSSL Tested on SEVIRI data for 6-9 April, July, Oct 2005 Validated against NIMROD radar over western Europe (example on right with NIMROD on top) Performance meets F&PS requirements 12
Cloud PropertiesAndy Heidinger and Michael PavolonisTheoretical Description Figure on the right illustrates the cod-ceps solution space for a given viewing geometry and surface reflectance. This information for all viewing geometries comprises the lookup tables used in the forward model. Our tables were optimized to capture the variations of reflectance with cod and ceps and to minimize memory. 14