Download
1 / 7
90 likes | 460 Views
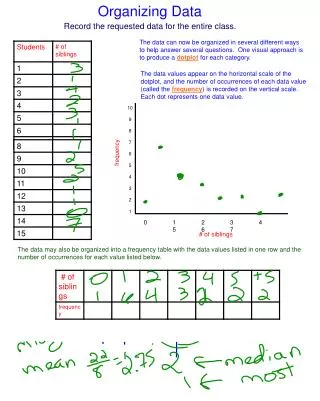
*When conducting an experiment, it is necessary to record all your data . *To organize data, you should make a table * Graphs help us interpret data easier. 1-3 Organizing Data. *There are 3 types of graphs: ~ pie chart : compares parts to whole

E N D
*When conducting an experiment, it is necessary to record all your data. *To organize data, you should make a table *Graphs help us interpret data easier 1-3 Organizing Data
*There are 3 types of graphs: ~pie chart: compares parts to whole ~line graphs: for data that changes over time ~bar graphs: to compare similar items
*Used to write very large or small numbers: 18000 = 1.8 x 10⁴ *The number before the decimal MUST be between 1 and 9 Scientific Notation
p. 23 Practice 1. a. 800,000,000 m= _______________ b. 0.0015 kg =_______________ c. 60,200 L = _______________ d. 0.00095 m = _______________ e. 8,002,000 km = _______________ f. 0.00000000006 kg = _______________
2. a. 4.5 x 10³g = _______________ b. 6.05 x 10⁻³m = _______________ c. 3.115 x 10⁶km = _______________ d. 1.99 x 10⁻⁸cm = _______________
Precision-exactness of a measurement Accuracy- how close a number comes to the true value