Organizing Data
Organizing Data. Record the requested data for the entire class. The data can now be organized in several different ways to help answer several questions. One visual approach is to produce a dotplot for each category.

Organizing Data
E N D
Presentation Transcript
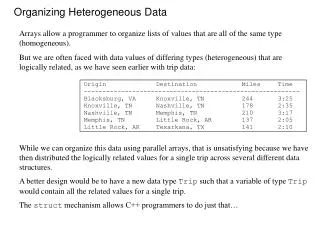
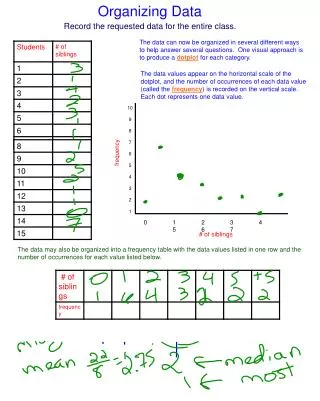
Organizing Data Record the requested data for the entire class. The data can now be organized in several different ways to help answer several questions. One visual approach is to produce a dotplot for each category. The data values appear on the horizontal scale of the dotplot, and the number of occurrences of each data value (called the frequency) is recorded on the vertical scale. Each dot represents one data value. 10 9 8 7 6 5 4 3 2 1 frequency 0 1 2 3 4 5 6 7 # of siblings The data may also be organized into a frequency table with the data values listed in one row and the number of occurrences for each value listed below.
Measuring the center of a frequency distribution is a basic starting point in many statistics applications. Each of the following is a statistic that measures the central tendency of a frequency distribution. ·The mean is the average found by adding the data values and dividing by the number of values. ·The median is in the exact middle of the numerically ordered data, half the data values lie above and half lie below the median. (if there is an even number of data values, the median is the mean of the two middle values.) ·The mode is the data value that occurs most frequently. (if no value appears more frequently there is no mode) ·The midrange is the exact midpoint between the lowest and highest data values. Now find the mean, median, mode, and midrange for the data we collected. Mean: Median: Mode: Midrange:
A histogram or bar graph is similar to a dotplot with rectangles or bars showing the frequency of each data value. Consider the two histograms. Without calculating the mean explain the difference between the measures of central tendency. 1 2 3 4 5 1 2 3 4 5