Download
1 / 23
230 likes | 322 Views
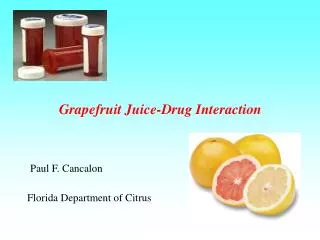
To protect, promote and improve the health of all people in Florida through integrated state, county, and community efforts. HIV Infection Among Those with an Injection Drug Use*-Associated Risk, Florida, 2012. Florida Department of Health HIV/AIDS and Hepatitis Section

E N D
To protect, promote and improve the health of all people in Florida through integrated state, county, and community efforts. HIV Infection Among Those with an Injection Drug Use*-Associated Risk, Florida, 2012 Florida Department of Health HIV/AIDS and Hepatitis Section Division of Disease Control and Health Protection *Injection Drug Use (IDU) data in this slide set include IDU and MSM/IDU cases Data as of 06/30/2013 Created: 09/01/13 Revision: 09/17/13
Definitions of Mode of Exposure Categories • MSM = Men who have sex with men • IDU = Injection Drug Use • MSM/IDU = Men who have sex with men & Injection Drug Use • Heterosexual = Heterosexual contact with person with HIV/AIDS or known HIV risk • OTHER = includes hemophilia, transfusion, perinatal and other pediatric risks and other confirmed risks. • NIR = Cases reported with No Identified Risk • Redistribution of NIRs = This illustrates the effect of statistically assigning (redistributing) the NIRs to recognized exposure (risk) categories by applying the proportions of historically reclassified NIRs to the unresolved NIRs.
Injection Drug Use-Associated Risk • Adult cases represent ages 13 and older, pediatric cases are those under the age of 13. For data by year, the age is by age of diagnosis. For living data, the age is by current age at the end of the most recent calendar year, regardless of age at diagnosis. • Unless otherwise noted, IDU data in this slide set include adult cases with an IDU or MSM/IDU mode of exposure. • Unless otherwise noted, whites are non-Hispanic and blacks are non-Hispanic. • Unless otherwise noted, NIRs have been redistributed. • Total statewide data will include Department of Correction Cases (DOC) unless otherwise noted. County data will exclude DOC cases. • Data in these slides represent living (prevalent) HIV/AIDS cases (PLWHAs) reported through the most recent calendar year. HIV prevalence data are generated later in the year, usually in May, when most of the “expected” death data are complete.
Adult AIDS Cases by Mode of Exposure, Reported through 2012 vs. in 2012, Florida Through 2012 N=125,037 In 2012 N=2,773 Note: NIRs redistributed. In more recent years, the proportions of cases with a heterosexual risk reported has increased whereas the proportions of cases with an IDU or MSM/IDU risk has decreased.
Injection Drug Use-Associated Transmission Modes among Adults Living with HIV Disease, Reported through 2012, Florida N=17,289 Note: Of the 98,530 persons living with HIV disease through 2012, 17,289 (18%) were IDU-associated. *Child of IDU includes those with mother’s who were IDU or had a sex partner that was IDU.
Perinatally Acquired HIV Infection Cases Born in Florida, by Mother’s Mode of Exposure and Year of Birth, 1979 through 2012 N=1,197 Note: Exploded pieces are IDU-related cases. NIRs are redistributed. Injection drug use directly or indirectly accounts for 35% of the perinatally acquired HIV infection cases.
Perinatally Acquired HIV Infection Cases Born in Florida, by Mother’s Mode of Exposure and Year of Birth, 1979-2012 N=1,197 Note: Since 1992 a steady decline was observed for all risks, although heterosexual contact remains the primary mode of exposure among mothers infected with HIV.
Males Females Injection Drug Use-Associated Adult HIV Disease Cases, by Sex and Year of Report, 2003-2012, Florida M:F Ratio 2003 2.3:1 2012 2.4:1 Comment: Male IDU-related risk includes both IDU and/or MSM/IDU for Adults ages 13+NIRS redistributed. Decreasing trends are observed among both males and females. The male-to-female ratio inclined slightly from 2.3:1 in 2003 to 2.4:1 in 2012.
Injection Drug Use-Associated Adult HIV Cases, by Age at HIV Diagnosis and Year of Report, 2003-2012, Florida Comment: IDU-related risk includes both IDU and/or MSM/IDU for Adults ages 13+. Over the past ten years, proportional increases were observed among both the 20-29 and 50+ age groups.NIRS not redistributed.
Adult Males Living with HIV Diseaseby Race/Ethnicity and Mode of Exposure Reported through 2012, Florida Hispanic N=16,037 White N=24,411 Black N=27,467 Note: NIRs redistributed. Among males living with HIV disease, the distribution of risk among blacks differs from that among whites and Hispanics. MSM represents the highest risk for all races. White males have the smallest proportion of heterosexual contact cases.
Adult Females Living with HIV Diseaseby Race/Ethnicity and Mode of Exposure Reported through 2012, Florida Hispanic N=3,915 White N=4,524 Black N=20,104 Note: NIRs redistributed. Among females living with HIV disease, the distribution of risk among whites differs from that among blacks and Hispanics. Heterosexual contact is the majority risk for all races, however, whites have the highest proportion of IDU cases.
0 1-100 101-500 501-1,000 > 1,000 Persons Living with HIV/AIDS (PLWHAs),* with an Injection Drug Use-Associated Risk,** by County of Residence,*** Reported through 2012, Florida PLWHAs with IDU-related Risk N=13,065 * Adult Cases Only ** IDU includes IDU and MSM/IDU cases *** County data excludes DOC cases (N=1,596) Data as of 06/30/2013
Adults Living with HIV/AIDS (PLWHA)§with an Injection Drug Use-Associated Risk,for Selected Counties, Reported through 2012, Florida § Persons Living with HIV/AIDS (PLWHA). Note: NIRs redistributed.
Adults Living with HIV/AIDS (PLWHA)*with an Injection Drug Use-Associated Risk, for Eligible Metropolitan Areas (EMAs), Reported through 2012, Florida
Selected Substance Abuse among High School Students, by Grade, as captured in the Youth Risk Behavior Survey (YRBS), Florida, 2011 9th 10th 11th 12th 5+ drinks in a row in past 30 days 12.2% 16% 23.7% 24.8% Marijuana use in past 30 days 16.9% 20.3% 26.7% 26.2% Cocaine use (any) in past 30 days 3% 3.2% 3.7% 2.8% Note: Two-stage Random Sample of 6,212 High School Students. Data is current as of 3/25/2013. For more details on Florida YRBS, go to: http://www.doh.state.fl.us/disease_ctrl/epi/Chronic_Disease/YRBS/Intro.htm
Selected Substance Abuse among High School Students, by Race/Ethnicity, as captured in the Youth Risk Behavior Survey (YRBS) Florida, 2011 Total White Black Hispanic 5+ drinks in a row in past 30 days 19.1% 23.1% 9.2% 20.8% Marijuana use in past 30 days 22.5% 22.6% 19.1% 25.1% Cocaine use (any) in past 30 days 3.4% 2.9% 1.4% 5.6% Note: Two-stage Random Sample of 6,212 High School Students. Data is current as of 3/25/2013. For more details on Florida YRBS, go to: http://www.doh.state.fl.us/disease_ctrl/epi/Chronic_Disease/YRBS/Intro.htm
National HIV Behavioral Surveillance (NHBS) among Injection Drug Users (2005-2006) • Respondent-driven sampling (respondents refer others to participate) was used to recruit 934 IDUs (persons who injected drugs within the past 12 months) in Miami-Dade and Broward counties. • A majority of the recruits (62%) reported testing for HIV in the past 12 months; nearly all (96%) reported testing for HIV in their lifetime • One in 6 (16%) self-reported as HIV+ • One-third of the recruits (34%) reported testing for HCV in the past 12 months; a majority (77%) reported testing for HCV in their lifetime • One in 3 (32%) self-reported as HCV+ Note: Analysis excludes persons diagnosed with HIV infection over 12 month prior to study. For full details on this study go to: http://www.doh.state.fl.us/Disease_ctrl/aids/Behavioral_Surveillance/Florida_NHBS_IDU_Data_at_a_Glance12_10_08.pdf
HIV Infection and HIV-Associated Behaviors Among Injection Drug Users – 20 Cities, United States, 2009 CDC’s National HIV Behavioral Surveillance System (NHBS) conducts interviews and HIV testing in selected metropolitan statistical areas (MSAs). This report summaries data from 10,073 IDUs (persons who injected drugs within the past 12 months) interviewed and tested in 20 MSAs in 2009. Of the IDUs tested, 9% had a positive HIV test result, and 45% of those testing positive were unaware of their infection. Among the 9,565 IDUs with HIV negative or unknown HIV status before the survey: 69% reported having unprotected sex vaginal sex, 34% reported sharing syringes, and 23% reported having unprotected heterosexual anal sex during the 12 pervious months Yet for the previous 12-month period, only 49% of IDUs at risk for acquiring HIV infection reported have been tested for HIV. Note: Analysis excludes persons diagnosed with HIV infection over 12 month period prior to study. Source: CDC. (2012, March 2). HIV infection and HIV-associated behaviors among injecting drug users – 20 cities, United States, 2009. Morbidity and Mortality Weekly Report, 61(8), 133 – 137. Retrieved June 10, 2013 from http://www.cdc.gov/mmwr/pdf/wk/mm6108.pdf (2009 data is the most recent data available)
For Florida HIV/AIDS Surveillance Data Contact: (850) 245-4444 Lorene Maddox, MPH Ext. 2613 Tracina Bush, BSW Ext. 2612 Madgene Moise, MPH Ext. 2373 Visit Florida’s internet site for: Monthly Surveillance Reports Slide Sets and Fact Sheets Annual Reports and Epi Profiles http://www.doh.state.fl.us/disease_ctrl/aids/trends/trends.html Visit CDC’s HIV/AIDS internet site for: Surveillance Reports, fact sheets and slide sets http://www.cdc.gov/hiv/topics/surveillance/resources/reports/index.htm