Download
1 / 10
100 likes | 121 Views
Learn how to create a compelling research presentation with tips on formatting, graphs, and data interpretation. Enhance audience engagement by avoiding common mistakes. Receive guidance on preparing for Q&A sessions and citing sources properly.

E N D
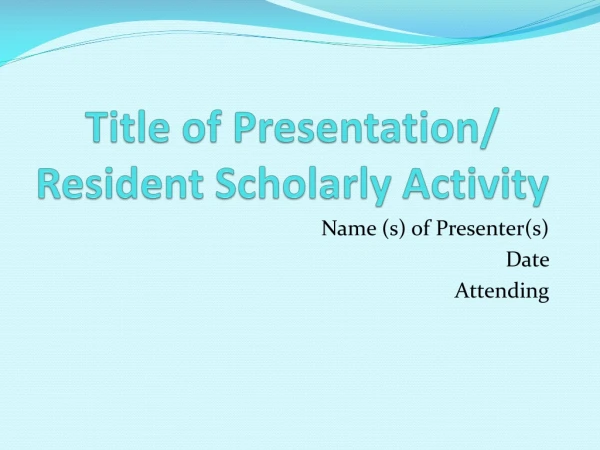
Title of Presentation/ Resident Scholarly Activity Name (s) of Presenter(s) Date Attending
Title of Research Studied • What did you study? • Who assisted you? • What questions were you asking? • Tips for Presentation: • Use bullet points- They make it easy for your audience to follow • Do not overload your slides with text • Do not read from your slides when presenting
Findings • Here, you can use charts or numbers to describe your findings. • You can do this through a chart or a graph. • Tips: • Numbers can be confusing-Use as few as possible • If you have more than 12-15 numbers on a slide, that’s probably too many. • Using only one number per sentence helps the audience absorb the data • Make sure you place a key with your chart or graph • Charts need to be clearly labeled.
Findings • Here, you can talk about what you found in statistics. • Tips: • Use the same style for numbers on a slide. For example, do not use 25% in on bullet point and 14 out of 200 in the next. • Cite your source on the same slide as the statistic, using a smaller size font.
Findings • Numbers in tables are both hard to see and understand. There is usually a better way to present your numerical data than with columns and rows of numbers- Get creative! • Overuse of a text is a common mistake- If your audience is reading the slides, they are not paying attention to you and your presentation. • It is distracting if you use too wide a variety of fonts. Try to stick with the same fonts for titles and the same fonts for the text boxes.
Conclusion • Summary of your findings • What did you find the most difficult? • What did you find helpful? • Suggestions for future residents? • Resources you used (the Library, Research Team, End Note, etc.)
Reference List • Be sure to list your references correctly!
Tips for A Good Presentation • Type key words in the PowerPoint Notes area listing what to say when displaying the slide. The notes are printable. • Number your slides and give them a title • ***PROOF READ, PROOF READ, PROOF READ***EVERYTHING including visuals and numbers.
Tips for a Good Presentation • Use contrast with backgrounds and text: light on dark or dark on light. • Font size must be large enough to be easily read. Size 26- 34 is recommended. • Anticipate questions you may be asked and have a response to them prepared.
Resources: • The Greenblatt Library • Your Family Medicine Research Team is here to assist YOU! Contact us at 706-721-4510 or come see us on the 2nd Floor (HB 2050) with any questions or concerns you may have regarding research.