Download

1 / 91
910 likes | 1.18k Views
Who are the Learning Disabled? Is There a Future for A Cognitive Basis? Evidence from Meta-Analyses and Longitudinal Research . H. Lee Swanson University of California-Riverside Institute for Education Sciences June , 2009. Overview of Meta-Analyses.

E N D
Who are the Learning Disabled?Is There a Future for A Cognitive Basis?Evidence from Meta-Analyses and Longitudinal Research H. Lee Swanson University of California-Riverside Institute for Education Sciences June , 2009
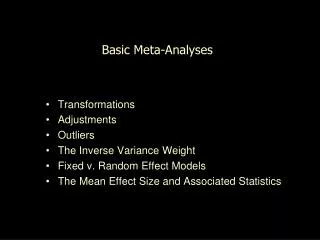
Overview of Meta-Analyses 1. Meta-analyses of Cognitive and RTI Research (in process)—with Brenda Arellano, Loan Tran and Tori Sanchez 2. Meta-Analysis of Adults with RD • Funded by NIFL (with Ching-Ju (Rosie) Hsieh—under review 3. Meta-Analysis of Memory and RD (JLD,2009 with Xinhua Zheng and Olga Jerman)
Overview of Reading and Math Projects 4. Meta-Analysis of Correlational Data on Phonological Awareness, Rapid naming and Reading (Review of Educational Research, 2003) Key Collaborators Guy Trainin, Denise Necoechea 5. Meta-analysis of Discrepancy and Non-Discrepancy Poor Readers (School Psychology Review-2000) Key Collaborator—Maureen Hoskyn
Overview of Reading and Math Projects • 6. Current—Math Disabilities vs. RD, RD and MD—2007 Review of Educational Research • Key collaborators—Olga Jerman, Georgia Dukas, Rebecca Gregg • 7. Meta-Analysis of Experimental Intervention Research in LD (RER, 1998, JLD, 2000, 2003) • Several collaborators— • Key collaborators- Maureen Hoskyn and Carole Lee
Issue 1. Progress Toward Operational Definitions • Agree on Subtypes relevant to academic outcomes----Three currently • New—directions explore high order definitions—problem solving, comprehension • Explore Cognitive Basis for definitions
Assumption related to the definition • 1. Not due to inadequate opportunity to learn, general intelligence, or to significant physical or emotional disorders, but to basic disorders in specific psychological processes (e.g., remembering the association between sounds and letters). • 2. Not due to poor instruction, but to specific psychological processing problems that have a neurological, constitutional, and/or biological base. • 3. Not manifested in all aspects of learning. Such individual’s psychological processing deficits depress only a limited aspect of academic behavior. For example, such individuals may suffer problems in word recognition, but not calculation.
How researchers generally operationalize SLD • 1. There are two subtypes that have some consensus: • reading disabilities and mathematical disabilities. –also consider comorbid group • 2. These subtypes are defined by standardized (normed referenced) and reliable measures of intelligence and achievement. The most commonly used intelligence tests are from the Wechsler measures and common achievement tests that include measures of word recognition or arithmetic calculation (e.g., WIAT, WRAT, WRMT). • 3. In general, individuals with IQ scores (e.g., verbal) equal to or above a standard score of 85 and reading subtest scores equal to or below the 25th percentile and/or arithmetic subtest scores equal to or below the 25th percentile reflect two high incidence disorders within LD: reading (word recognition), and arithmetic (computation, written work). • 4. By far, the subtype that has received the most research attention is reading disabilities.
Some issues in the area of cognition • 1. Clouded by conflicting evidence on IQ and reading discrepancy research— • (logic that similarities in overt behavior reflect the same inefficiencies and/or of cognitive processes—consider MD and RD) • 2. Clouded by previous cognitive intervention research (poor generalization to changes in academics) • 3. Psychometric aspects of measures in question
4. Inadequate research framework which clouds interpretation of outcomes • 5. Knowing cognitive deficits does not indicate teaching directions • 6. There are few analogs (low inference observation measures) linking cognitive performance to classroom performance
Perspective • 1. Purpose of assessing cognition is to explain the “why” and “predict” how individual differences account for treatment outcomes • 2. Purpose of an instructional approach (e.g., RTI) is to monitor the intensity of intervention (instruction) and make systematic changes as a function of overt performance— • Pt----the approaches are complementary - • Pt-The study of cognition has the potential to outline constraints in learning when individual differences cannot be explained as a function of best instructional practice • Pt—instruction accounts for less than 20% of the variance in effect sizes (Swanson, 1999; Simmerman & Swanson, 2001)
Table 2. Regression model predicting effect size as a function of methods composite score, age, and instructional components
Table 2 • Predictions of Year 3 Problem Solving Accuracy Based on Wave 3 Math Calculation, • Problem Solving Knowledge and Wave 1 Fluid Intelligence, Reading and Cognitive Variables • Model 5 B SE ß t • Wave 3 Predictors • Problem Solving Knowledge 0.25 0.11 0.12 2.13* • Calculation 0.30 0.08 0.27 3.42** • Wave 1 Predictors • Fluid Intelligence (Raven) 0.13 0.04 0.16 2.85** • Reading 0.12 0.12 0.12 1.00 • Phon. Know. -0.01 0.10 0.10 -0.09 • Fluency 0.02 0.07 0.007 0.33 • Speed -0.004 0.06 -0.004 -0.06 • Inhibition 0.09 0.06 0.07 1.60 • Age -0.15 0.06 -0.16 -2.39* • Sketchpad 0.15 0.04 0.14 3.23*** • Phon. Loop 0.12 0.06 0.09 1.85 • Executive 0.19 0.08 0.15 2.34* • Model 5 F (12, 279) = 22.52; p< .001, R2 = .49
Issue 2: Determine Meaningful Outcomes • 1. Control group needs to include significant instructional moderators (e.g.,DRP, overlap with treatment) • 2. Determine the role definitional moderators
Why Do A Meta-Analysis to address these questions? • 1. Evidence Based—Pattern across several studies vs. single study---vs. overstated or understated information • 2. Influence of sample (age, IQ, Discrepancy) and intervention parameters (time,responsiveness vs. resistance to instruction, components of instruction) on outcomes. • 3. Theory Testing---identify the core problem---area most resistant to intervention • 4. Allows for Replication
Interpretation For the purpose of discussion, Cohen’s (1988) distinctions on the magnitude of the effect size will be used. * .20 is a small size * .60 is a moderate size * .80 is a large effect size
Can we ignore cognition by focusing primarily on evidence-based instruction ?What do we know related to evidence based intervention and where should we go?1. Meta-Analysis of Experimental Interventions and LD (e.g., RER, 1989, JLD 2001).2. Meta-analysis of Dynamic Assessment (e.g., RER, 2001)3. Meta-analysis of RTI research (in progress)
Criteria • Computer search, dissertations, state department reports- 3000 manuscripts . Control group, average intelligence, minimum of 3 sessions, ES can be calculated. Final 180 group design (K=1,537) and 85 single subject design studies (K=793)
Bottom line for evidence based studies • 1. Mean ES between LD in control and TRT .56 • 2. Mean ES between LD (Exp. TRT) and NLD in .97 • 3. Majority of Studies measure Reading • 4. Several variables significantly moderate treatment outcomes (IQ & Reading, teacher effects, # components overlap, standardized vs. experimental measures, ratings on internal and external validity) • 5. Combined Strategy and Direct instruction most robust procedure
Table 4 Weighted Mean, Effect Sizes for Group Design Studies as a Function of Dependent Measure Category LD Treatment vs. LD Control K N Effect Size Q Effect Size Q 95 % Confidence Interval Standard Error Unwe ighted* Weighted" for Weighted Effects Lower Upper 1. Cognitive Processing 41 115 .87 .54 .48 .61 .03 1 a. Metacognitive 9 27 .98 .80 .66 .94 .07 1b. Attribution 7 17 .79 .62 .44 .79 .08 I c. Oth er Processes 25 71 .65 .46 .38 .53 .03 2. Word Recognition 54 159 .71 .57 .52 .62 .02 2a. Standardized 23 79 .79 .62 .54 .69 .04 2b. Experimental 35 80 .72 .53 .48 .60 .03 3. Reading Comprehension 58 176 .82 .72 .68 .77 .02 3a. Standardized 16 38 .45 .45 .36 .54 .05 3b. Experimental 44 138 .84 .81 .75 .86 .02 4. Spelling 24 54 .54 .44 .37 .52 .04 4a. Standardized .8 20 .61 .45 .34 .57 .06 4b. Experimental 18 34 .48 .44 .33 .54 .05 5. Memory/Recall 12 33 .81 .56 .43 .70 .06 6. Mathematics 28 71 .58 .40 .33 .46 .04 6a. Standardized 9 22 .41 .33 .23 .46 .05 6b. Experimental 21 49 .59 .42 .34 .51 .04 7. Writing 19 67 .84 .63 .54 .72 .05 II . 7a. Standardized 3 7 .37 .36 .14 .58 7b. Experimental 16 60 .80 .68 .59 . 78 .04 8. Vocabulary 11 20 .79 .78 .66 .89 .05
TABLE 25. Mean Effect Sizes on Instructional Components Comparing LD in Treatment Conditions to NLD Participants
What about Bob (IQ) ? • 1. Does IQ relate to treatment outcomes ? • Rephrase the question—if IQ is left out of the definition will it influence treatment outcomes?
Instructional Outcomes as A Function of IQ and Reading Level
Bottom Line ON IQ • 1. LD in Exp. Condition vs. average ES=.69 for IQ+RD information • ES=1.41 for no IQ + RD information • 2. LD in Exp. vs. LD in Control • ES=.63 for IQ+RD information • ES=.82 for no IQ +RD information • ES=.60 for IQ+RD+Math information
Mixed Regression Modeling for Predicting Estimates of Effect Size in Cognitive Processing
A speculation • Based on studies that include optimal instructional conditions—the mean effect size one could expect comparing LD with nonLD is (tier 2 or 3)---- • D-R-P (.78) • Systematic Probing (.73) • Peer Mediation (.52) • Strategy Cuing (.74) • Mean ES=.69 under evidence based instruction---which may varying depending on the entry of new data--
Issue 4:Develop Standardized Measures related to Dynamic Assessment • Can we detect LD early with DA procedures?---longitudinal research • DA of Cognitive and/or Academic?
Synthesis of Experimental on Dynamic Assessment (RER, 2001) • Criteria for Selection • 1. Published Refereed Journal • 2. Control group comparison (between and within comparisons) for DA vs. static or traditional measurement (no feedback) • 3. 30 articles from 303 potential (majority eliminated because ES could not be calculated, duplicate data) articles analyzed
Questions • Is new information gained by DA procedures relative to traditional assessment? • Are some groups of children more responsive then others? • Which DA procedures yield the highest outcomes (relative to traditional assessment )?
Results and Implications for LD---DA vs. traditional • 1. Lower effect sizes emerge for LD relative to other categories of children • 2. Largest ESs occur for underachievers • 3. Testing limits (e.g., scaffolding---various cuing procedures) and general strategies (general feedback, modeling strategies) yielded higher outcomes than test-train-test models • Implication---LD sample performance as a function of DA is hard to change relative to other groups--
Issue 5: determine if RTI studies can change risk factor of children already with serious risk factors (beyond what psychometric studies can provide)----is there better explanatory power knowing general areas of cognition? • IS RTI itself a wait and fail situation???
Meta-analytic look at RTI findings Criteria for Selection 1. Published Study (1985-2008)- 2. Divided sample into responders and nonresponders 3. Focus on reading-Elementary 4. Reported Pretest Scores by Responders and Nonresponders 5. Reported Standardized scores 6. Allow for calculation of ES Only 9 studies met criteria (119 ES)
Issues facing RTI and how a Meta-analysis can help • 1. No (or few) systematic control studies (none meeting the gold standard) comparing RTI with a competing model of classification • 2. RTI is a function of instruction (as well as teachers), and because there is no standardized protocol for instruction—how well can people generalize from findings to classify child at risk across school districts? • 3. No consensus on definition of what resistance to instruction should be (slope of 0 or .25 or benchmarks?)---Is the issue really intercept level and not change (slope)?
Group Design RTI Studies (Responder vs. nonresponder in the same evidence-based intervention)
Tentative Conclusions (RTI Studies) • 1. Pretest differences for some children seriously at risk remain stable—and a source for determining LD • 2. Instruction is not robust enough to ignore individual differences in achievement and “perhaps” cognition
Conclusion on Interventions—Who are the SLD ? • Children who yield low outcomes under optimal instructional conditions (components that significantly and positively influence effect sizes • Those optimal instructional components that predicted treatment outcomes---Drill-repetition-skills, strategy training and small interactive groups • Definition does influence outcomes-IQ and Reading Scores in combination are not irrelevant to instructional outcomes (at least from this data set). Average IQ and low Reading group (< 25th percentile) appears to be one subgroup most at risk in terms of the magnitude of outcomes.
The Assessment Side of LD • What Cognitive Variables are Important in Assessing RD and MD in children? • Do risk factors related to Cognition go away in adulthood?
Issue 6: What are the important cognitive processes to consider in in children and adults with LD ? • What are the common cognitive deficits among subgroups? • What are the non-overlapping cognitive deficits among subgroups? • What deficient cognitive processes operate independent of classification variables--