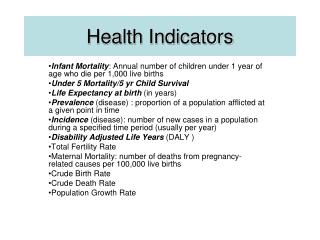
Indicators
Indicators. Regional Workshop on the Monitoring and Evaluation of HIV/AIDS Programs February 14 – 24, 2011 New Delhi, India. Session Objectives. Understand how indicators are linked to frameworks Describe how to operationalize indicators

Indicators
E N D
Presentation Transcript
Indicators Regional Workshop on the Monitoring and Evaluation of HIV/AIDS Programs February 14 – 24, 2011 New Delhi, India
Session Objectives • Understand how indicators are linked to frameworks • Describe how to operationalize indicators • Identify the role of indicators at different levels (national, sub-national, project) and the linkages between them • List sources of indicators that are international standards • Select indicators and define indicators for an M&E plan
An Indicator is… • a variable (its value changes) • that measures (objective calculation of value) • key elements of a program or project • Inputs, processes, outputs, outcomes
Indicators provide critical M&E data at every level (and stage) of program implementation • Inputs, Process • Was the program carried out as planned? • How well was it carried out? • Outputs, Results • Did the expected change occur? • How much change occurred? • Outcome, Impact • Has the outcome changed in desired direction? • Does the change signal program “success”?
Logic Model Indicators • OUTPUT • Providers trained in updated PMTCT service provision • IMPACT • Reduced perinatal transmission of HIV • INPUT • Human and financial resources • Development of training materials • PROCESS • Conduct one PMTCT training workshop in each district for providers • OUTCOME • Increased use of PMTCT services Indicator: percent of infants HIV+ born to HIV+ women Indicator: # of providers who have completed clinical training Indicator: percent of HIV+ women receiving a complete course of ARV prophylaxis Indicator: % of pregnant women who are HIV tested
Results Framework Example – PEPFAR funded ART Program SO: Increased utilization of ART services IR-1: Availability of quality services IR-2: Demand for services IR-1.1: Increase ART sites IR-2.1: Increase knowledge of ART IR-1.2: Supply sites with ARVs IR-2.2: Increase referral from VCT IR-1.3: Training for providers
Results Framework Indicators PEPFAR funded ART Program IR-1: Availability of quality services # of districts with at least one facility providing ART services in line with national standards # of ART sites IR-1.1: Increase ART sites % of ART delivery points experiencing stock-outs in the preceding six months IR-1.2: Supply sites with ARTs # of health workers trained on ART delivery in accordance with national or international standards IR-1.3: Training for providers
Results Framework Indicators PEPFAR funded ART Program SO: Increased utilization of ART services # of HIV + persons receiving ART therapy
Decreases Number of Indicators Increases Indicator Pyramid Global Compare countriesOverview world-wide situation • National/Sub-national • Assess effectiveness of response • Reflect goals/objectives of national/sub-national response • District, Facility, Project • Identify progress, problems, and challenges
Linkages between levels • Often, indicators at the higher levels in the pyramid are linked to those at the lower levels. • Data may be collected at the district level and passed up to the national level and on up to the global level. • Requires an M&E system to support data flow, compilation, and aggregation
Characteristics of good indicators • Valid: accurate measure of a behavior, practice or task • Reliable: consistently measurable in the same way by different observers • Comparable: can be measured in different contexts or time periods • Non-directional: subjective criteria not part of definition
Characteristics of good indicators (cont.) • Precise: operationally defined in clear terms • Measurable: quantifiable using available tools and methods • Timely: provides a measurement at time intervals relevant and appropriate in terms of program goals and activities • Programmatically important: linked to a public health impact or to achieving the objectives that are needed for impact
Common Indicator Metrics • Counts • # of providers trained • # of condoms distributed • Calculations: percentages, rates, ratios • % of facilities with trained provider • % of FSW who used a condom at last sex with a client • Index, composite measures • Index on infection control prevention • DALY (Disability Adjusted Life Years) • Thresholds • Presence, absence • Pre-determined level or standard
Operationalizing indicators Establish exactly how a given concept / behavior • will be measured • precise definition and metric • how the value will be reliably calculated • (anyone using the same data will arrive at exactly the same indicator value)
Always specify the details! who/what qualifies to be counted, and when Number of providers trained in PMTCT services “providers”: any clinician providing direct clinical services to women seeking ANC at government health facilities “trained”: attended a two-week training course on PMTCT in past year
Always specify the details! How to calculate it Percent of health facilities with a provider trained in PMTCT services “Numerator”: Number of public facilities with a provider who attended a two-week PMTCT training course in past year “Denominator”: Number of public facilities offering ANC services in the past year
Always specify the details! • Threshold indicator for VCT program • VCT centers with minimum conditions to provide quality services • Facility provides quality VCT services if the following necessary structural elements are present • Trained staff • Adequate privacy for counseling • Systems for maintaining confidentiality • Directory of services for referral • Adequate conditions for ensuring quality control of specimen tests
Limitations All indicators have limitations, even those commonly used: • Blood safety: cannot monitor private facilities adequately • Sexual behavior(e.g. condom use, number of partners): self reporting bias • Sero-surveillance: get biased population (pregnant women and other populations) • Population-based HIV prevalence: refusal bias , sampling bias
Frequency of Reporting on Indicators • Input/Process: Continuously • Output: Quarterly, semi-annually, or annually • Outcome: 1-3 years • Impact: 2-5 years
The Role of Target Setting • Important element of strategic planning • Tracking progress towards achieving targets assists with resource allocation and improves program management • Often a requirement for performance-based funding
Main Steps in Target Setting • Define the populations and subpopulations in need of services (treatment, diagnostic, care, prevention, etc) • Assess existing coverage to identify gaps • Determine potential achievements within the time frame given resource availability, opportunities, and constraints • Set ambitious but realistic targets!
Indicator Reference Sheets • Assist in detailed documentation of indicators • Clear definition of indicator, numerator, and denominator • Collection details – data source, frequency, who responsible
Content of Indicator reference sheets (see handout) • The linked result • Precise definitions for every term used • Reason for selection, how to interpret • Data requirements, data quality issues • How to measure and calculate • Data source, responsibilities, and frequency • Issues, limitations, significance • Data table (baseline and target values)
Guiding Principles to selecting indicators • Ensure that the indicators are linked to the program goals and are able to measure change • Ensure that standard indicators are used to the extent possible • Consider the cost and feasibility of data collection and analysis. • Keep the number of indicators to the minimum and include only those needed for program and management decisions or for reporting.
Good indicators: A Synopsis • Provide information useful for program decision-making • Are consistent with international standards and other reporting requirements, as appropriate • Are defined in clear and unambiguous terms • Non-directional, “independent,” and SMART • Have values that are: • Easy to interpret and explain • Precise, valid and reliable measures • Comparable across relevant population groups, geography, other program factors, as needed
Indicator Guides • National AIDS Programmes. A guide to monitoring and evaluation. UNAIDS (2000) • National AIDS Programs. A guide to indicators for monitoring and evaluating national HIV/AIDS prevention programs for young people. WHO (2004). • National guide to monitoring and evaluating programmes for the prevention of HIV in infants and young children. UNAIDS/WHO (2004) • National AIDS Programs. A guide to monitoring and evaluating HIV/AIDS care and support. WHO (2004). • National AIDS Programmes. A guide to indicators for monitoring and evaluating national antiretroviral programmes. WHO (2005).
Indicator Guides (cont.) • Guide to monitoring and evaluation of the national response for children orphaned and made vulnerable by HIV/AIDS. UNAIDS/WHO (2005) • A framework for monitoring and evaluating HIV prevention programs for most-at-risk populations (UNAIDS 2007) • Monitoring and Evaluation Toolkit. HIV/AIDS, Tuberculosis, and Malaria. GFTAM (2009). • Monitoring the Declaration of Commitment on HIV/AIDS. Guidelines on construction of core indicators. UNAIDS (2009) • ….and others!
Additional References • HIV/AIDS Survey Indicators Database • www.measuedhs.com/hivdata • UNAIDS 2010. Indicator Standards: Operational Guidelines for Selecting Indicators for the HIV Response. • http://www.globalhivmeinfo.org/ • UNAIDS Indicator Registry • http://www.indicatorregistry.org/
Not everything that can be counted counts, and not everything that counts can be counted. Albert Einstein
Group Activity: Adding Indicators to a Framework • Assemble group-work members • Use the worksheet “Linking Indicators to Frameworks” • Take about one hour to complete sheet • Resulting framework with indicators will to presented back by a group representative (5 minutes for each group) • The selection of indicators will form the basis of your plan, You will have the opportunity to revise this further based on feedback
MEASURE Evaluation is a MEASURE project funded by the U.S. Agency for International Development and implemented by the Carolina Population Center at the University of North Carolina at Chapel Hill in partnership with Futures Group International, ICF Macro, John Snow, Inc., Management Sciences for Health, and Tulane University. Views expressed in this presentation do not necessarily reflect the views of USAID or the U.S. Government. MEASURE Evaluation is the USAID Global Health Bureau's primary vehicle for supporting improvements in monitoring and evaluation in population, health and nutrition worldwide.