Download
1 / 15
150 likes | 334 Views
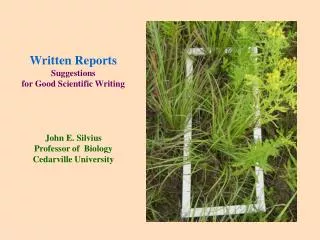
Written Reports Suggestions for Good Scientific Writing. John E. Silvius Professor of Biology Cedarville University. Written Reports Suggestions for Good Scientific Writing. Part I General Suggestions. Written Reports Suggestions for Good Scientific Writing.

E N D
Written ReportsSuggestions for Good Scientific Writing John E. Silvius Professor of Biology Cedarville University
Written ReportsSuggestions for Good Scientific Writing Part I General Suggestions
Written ReportsSuggestions for Good Scientific Writing Writing METHODS – A Few Suggestions 1. You may use first person plural (e.g. We estimated plant cover by using a …) or passive voice (e.g. Plant cover was estimated by …) 2. Place the subject of each sentence as early as possible in the sentence. Poor: “In order to determine plant height diversity, we measured …” Better: “Plant height diversity was based upon 3 Robel pole measurements…” 3. Make two concise sentences rather than a long string of clauses. 4. Be precise so that the reader could repeat your “Methods” and obtain your materials and instruments from your wording or via citation of Lab Manual.
Figure 1 Writing a Figure Legend What’s in this figure? 2002 Where? 2001 Method? Brief interpretation or save detail for “Results” if instructed. Figure 1. Rank-abundance curves for plant species of the Cedarville University Prairie Restoration, based on quadrat sampling during two different summers. A slightly greater species evenness was evident among the ten most abundant species in 2001 compared to 2002. Such comparisons, however, must consider the larger sample size in 2001. The 52 quadrat samples in 2001 expressed a more accurate estimate of species richness than the 19 samples in 2002.
Suggestions for Good Scientific Writing Preparing Figures:Read the “bubbles” to understand the intent: Chart title explains subject under investigation and its location and time frame. Axes labels give parameters. Legend repeats chart title (what-where-when), and cites “Methods” (how)… 2002 2001 …then, helps reader interpret the data... …and, notes any cautions. Figure 1. Rank-abundance curves for plant species of the Cedarville University Prairie Restoration, based on quadrat sampling during two different summers. A slightly greater species evenness was evident in 2001 compared to 2002. Such comparisons, however, must consider the larger sample size in 2001 (52 quadrat samples) as compared to 2002 (19 samples).
Suggestions for Good Scientific Writing Preparing Figures: Some ExamplesRead the “bubbles” to understand the intent: Chart title explains subject under investigation. Axes labels give parameters. Legend repeats chart title (what-where-when), and refers to “Methods” (how)… …then, helps reader interpret the data...
Suggestions for Good Scientific Writing Preparing Figures: Some ExamplesRead the “bubbles” to understand the intent: Legend states the “what-where-when” …then, helps reader interpret the data...
Written ReportsSuggestions for Good Scientific Writing Writing RESULTS or DISCUSSION: Which of the following sentences states the experimental results best? SENTENCE A:“Table 2 shows that the most dominant plant species are Indian Grass and Tall Goldenrod.” SENTENCE B:“The most dominant plant species of the prairie restoration site based upon random plot sampling are Indian Grass and Tall Goldenrod (Table 2).”
Concise Scientific WritingSuggestions for Good Scientific Writing RESULTS -- critique of SENTENCE A: SENTENCE A:“Table 2 shows that the most dominant plant species are Indian Grass and Tall Goldenrod.” “Table 2” above makes a poor subject. See SENTENCE B. But how are “dominants” judged? Include reference to method used to determine (see Sentence B.) But how is this judged? Include reference to method used to determine (see Sentence B. You need not “show” the reader the data. See reference to “(Table 2)” in SENTENCE B. SENTENCE B:“The most dominant plant species based upon random plot sampling are Indian Grass and Tall Goldenrod (Table 2).”
Written ReportsSuggestions for Good Scientific Writing Part II Using Statistics in Your Results and Discussion
Written ReportsSuggestions for Good Scientific Writing Writing RESULTS – Referring to Statistical Testing Which of the following sentences states the RESULTS best? SENTENCE A:“Figure 1 shows that plants grown under high light intensity had longer stem internodes as shown by our t-value of 2.81 which was significant p < 0.05 for 12 degrees of freedom.” SENTENCE B:“Increased light intensity caused significantly greater internode elongation in radish plants (p < 0.05) (Figure 1).”
Your variable (light intensity) should be the subject. See SENTENCE B Concise Scientific WritingSuggestions for Good Scientific Writing RESULTS -- critique of SENTENCE A: SENTENCE A:“Figure 1 shows that plants grown under high light intensity had longer stem internodes as shown by our t-value of 2.81 which was significant at the 95% level for 12 degrees of freedom.” The t-value itself is not significant. Rather it may indicate that the difference between two means is significant. You need not “show” the reader the data. See “(Figure 1)” in SENTENCE B. You need not go into this detail in RESULTS if you have explained what statistical test you used in METHODS. SENTENCE B:“Increased light intensity caused significantly greater internode elongation in radish plants (p < 0.05) (Figure 1).”
Concise Scientific WritingSuggestions for Good Scientific Writing Here is a critique of two sentences which refer to statistical probability. SENTENCE A:“Figure 1 shows that plants grown under high light intensity had longer stem internodes as shown by our t-value of 2.81 which was significant at the 95% level for 12 degrees of freedom.” Reader encounters subject first The “significantly greater” indicates that you have based your claim on statistical tests (see blue bubble below). SENTENCE B:“Increased light intensity caused significantly greater internode elongation in radish plants (p < 0.05)(Figure 1).” Reader will know where to find data by this brief reference. Low probability supports your claim of “significantly greater” meaning that you can reject Ho with < 5% chance of Type I error. “Methods” will note that you used t-test.
Poor subject Good (biology) subject Exhibit A: The probability suggests that disturbance does not enhance species richness (p > 0.10; Table 2). “Statistics subject” “biology is object of prep.” ● ● ♦ ( Exhibit B: The null hypothesis for species richness per sample should not be rejected. What was treatment in question? Omit so “bio subject” is up front Exhibit C: According to the calculated “p” value (p > 0.10), soil disturbance does not have an effect on species richness because there is more than a 10% chance that our null hypothesis would be correct. Can you fix this one?Mid-summer mowing did not affect species richness (p > 0.10).