Comprehensive Check Image Clearing Report Overview (Jan 2011)
This report provides an in-depth analysis of the check image clearing operations as of January 2011, detailing the transactions settled through key financial institutions such as the Federal Reserve, Viewpointe, and The Clearing House. The report highlights the significant growth in electronic check image exchanges, as well as the implementation of image exchanges for check collections and returns. Data shows an annualized average of over 16.5 billion images received, indicating a strong shift towards digital processing in the banking industry.

Comprehensive Check Image Clearing Report Overview (Jan 2011)
E N D
Presentation Transcript
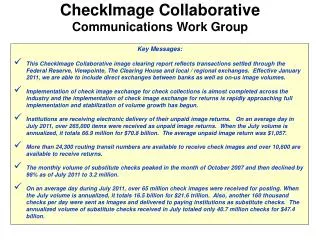
CheckImage Collaborative Communications Work Group • Key Messages: • This CheckImage Collaborative image clearing report reflects transactions settled through the Federal Reserve, Viewpointe, The Clearing House and local / regional exchanges. Effective January 2011, we are able to include direct exchanges between banks as well as on-us image volumes. • Implementation of check image exchange for check collections is almost completed across the industry and the implementation of check image exchange for returns is rapidly approaching full implementation and stabilization of volume growth has begun. • Institutions are receiving electronic delivery of their unpaid image returns. On an average day in July 2011, over 265,000 items were received as unpaid image returns. When the July volume is annualized, it totals 66.9 million for $70.8 billion. The average unpaid image return was $1,057. • More than 24,300 routing transit numbers are available to receive check images and over 10,600 are available to receive returns. • The monthly volume of substitute checks peaked in the month of October 2007 and then declined by 98% as of July 2011 to 3.2 million. • On an average day during July 2011, over 65 million check images were received for posting. When the July volume is annualized, it totals 16.5 billion for $21.6 trillion. Also, another 160 thousand checks per day were sent as images and delivered to paying institutions as substitute checks. The annualized volume of substitute checks received in July totaled only 40.7 million checks for $47.4 billion.
Highlights: Chart reflects volume received by DFIs for payment. Average daily image volume grew from 52.85 to 65.59 million from August 2009 to July 2011. July 2011 volume annualized is 16.5 billion images received per year. Average # of Images Received /Day # Items in Millions Data Sources: Transactions settled through the Federal Reserve, Viewpointe, The Clearing House, selected ECCHO Full and Participating Members and other local / regional exchanges Jul-11 Jun-10 Oct-09 Feb-10 Oct-10 Aug-09 Apr-11 Feb-11 Apr-10 Aug-10 Dec-09 Dec-10
Highlights: Chart reflects the number of R/Ts available to receive images from other DFIs or an intermediary. Number of image-available receiving R/Ts grew from 20,017 to 24,301 from August 2009 to July 2011. R/Ts Available to Receive Images # of Image-Available R/Ts Data Sources: Transactions settled through the Federal Reserve, Viewpointe, The Clearing House, selected ECCHO Full and Participating Members and other local / regional exchanges Jul-11 Apr-10 Dec-10 Jun-10 Oct-09 Apr-11 Oct-10 Feb-11 Feb-10 Aug-09 Dec-09 Aug-10
Highlights: Chart reflects checks received by DFIs for payment. The monthly dollar amount received grew from $1.43 to $1.72 trillion. Annualized July 2011 dollar amount = $ 21.6 trillion/yr. $ Amounts of Images & Substitute Checks Forward Collection Only $ Amounts in Billions Data Sources: Transactions settled through the Federal Reserve, Viewpointe, The Clearing House, selected ECCHO Full and Participating Members and other local / regional exchanges Jul-11 Apr-10 Dec-10 Jun-10 Oct-09 Apr-11 Oct-10 Feb-11 Feb-10 Aug-09 Dec-09 Aug-10
Highlights: Chart reflects volume received by DFIs for payment. Substitute Check volume has decreased to the volume of February ’05. # of Images & Substitute Checks Forward Collection Only # Items in Millions Images Data Sources: Transactions settled through the Federal Reserve, Viewpointe, The Clearing House, selected ECCHO Full and Participating Members and other local / regional exchanges Substitute Checks Jul-11 Apr-10 Dec-10 Jun-10 Oct-09 Apr-11 Oct-10 Feb-11 Feb-10 Aug-09 Dec-09 Aug-10
Number of R/Ts Highlights: Chart reflects the number of R/Ts available to receive unpaid image returns from other DFIs or an intermediary. From August 2009 to July 2011, the number of R/Ts available to receive unpaid image returns grew from 4,483 to 10,699. (Data sources were modified for August 2010 forward) Available to Receive Image Returns # of R/Ts Available to Receive Returns Data Sources: Transactions settled through the Federal Reserve, Viewpointe, The Clearing House, selected ECCHO Full and Participating Members and other local / regional exchanges Jul-11 Apr-10 Dec-10 Jun-10 Oct-09 Apr-11 Oct-10 Feb-11 Feb-10 Aug-09 Dec-09 Aug-10
Highlights: This chart reports the volume trend of unpaid image returns delivered electronically to the receipt location designated by the bank of first deposit. Between August 2009 to July 2011, the volume of image returns has increased by 70% from an average daily volume of 156,000 to 265,000 (20 days in July). Average # of Image Returns/Day # Items in Thousands Data Sources: Transactions settled through the Federal Reserve, Viewpointe, The Clearing House, selected ECCHO Full and Participating Members and other local / regional exchanges Jul-11 Apr-10 Dec-10 Jun-10 Oct-09 Apr-11 Oct-10 Feb-11 Feb-10 Aug-09 Dec-09 Aug-10
Highlights: This chart reports the dollar amount trend of unpaid image returns delivered electronically to the receipt location designated by the bank of first deposit. Between August 2009 and July 2011, the monthly dollar amount of image returns has grown from $3.8 to $5.6 billion. The average dollar amount of image returns ranged from a low of $1,057 per return to a high of $1,215. $ Amount of Returns $ Amounts in Millions Data Sources: Transactions settled through the Federal Reserve, Viewpointe, The Clearing House, selected ECCHO Full and Participating Members and other local / regional exchanges Jul-11 Apr-10 Dec-10 Jun-10 Oct-09 Apr-11 Oct-10 Feb-11 Feb-10 Aug-09 Dec-09 Aug-10
Highlights: Chart reflects volume received by DFIs for payment. Average daily image volume grew from .08 to 67.56 million from Qtr 1 2005 to Qtr 2 2011. Qtr 2 2011 volume annualized is 17.2 billion images received per year. Average # of Images Received /Day # Items in Millions Data Sources: Transactions settled through the Federal Reserve, Viewpointe, The Clearing House, selected ECCHO Full and Participating Members and other local / regional exchanges Qtr 2 ‘11
Highlights: Chart reflects check images received by DFIs for payment. The quarterly dollar amount of images received grew from $1.7 billion to $5.5 trillion. Annualized Quarter 2 2011 dollar amount = $22 trillion/yr. $ Amounts of Images Received by Paying Institution $ Amounts in Billions Data Sources: Transactions settled through the Federal Reserve, Viewpointe, The Clearing House, selected ECCHO Full and Participating Members and other local / regional exchanges Qtr 2 ‘11