Download
1 / 18
180 likes | 477 Views
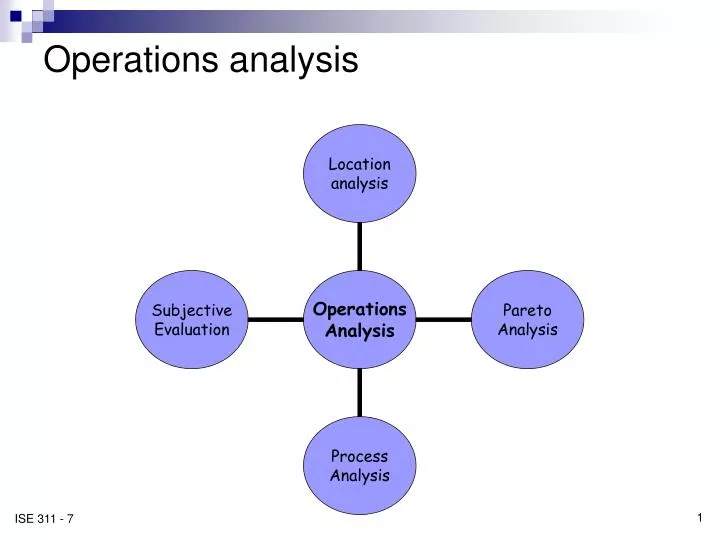
Operations analysis. Location analysis. Location of One Item Example: Locating printer, scanner, & copier station in a department. Systematic Layout of Multiple Items See pp. 90-93. B. 2. 1. 4. 3. 5. A. Pareto Analysis: ‘Fight the Giants’.

E N D
Location analysis • Location of One Item • Example: Locating printer, scanner, & copier station in a department. • Systematic Layout of Multiple Items • See pp. 90-93 B 2 1 4 3 5 A
Pareto Analysis: ‘Fight the Giants’ • Concept – bulk of the problems (opportunities) are concentrated in a few items • “Fight the Giants” • Example: causes of long wait times at a health clinic
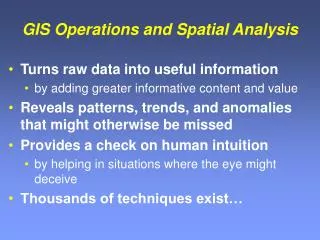
Process analysis • Overview of the process • Identify opportunities for improvement • Useful communication tool • Major types • Process chart • single object / person (Ergo) • assembly process • multi-activity chart (Ergo) • Flow diagram (Ergo, Visio) • Fish (Ishikawa) diagram (Visio) • Decision structure table
Process chart • Symbology • Details • time, distance • SEARCH • notes • Documentation • Example – preparing a form letter for mailing • see next page
Flow diagram • Usually combined with process chart to visualize physical space. • Example: Preparation and gathering for a design team meeting. (See next page.)
Other process charts • Assembly process charts • show relationships among components, how several processes interact • useful for methods analysis • identify delays, storage problems • example, pg. 97 • Multi-activity chart ‘gang chart’, ‘man-machine’ chart, ‘left-hand right hand’ chart • common, scaled time axis • identify idle time, unbalanced operations • opportunities for • job sharing • double tooling • kitting • examples, pg. 99
Fish diagrams • aka, Ishikawa diagram, Cause & Effect diagram • Useful for brainstorming, identify opportunities to improve • ‘Head’ of the fish is the problem or desired effect • ‘Skeleton’ identifies potential causes • 4 M’s – manpower, machines, methods, materials • 4 P’s – policies, procedures, people, plant
Example • Improve design team meeting productivity
Borg Vote – Rating of Perceived Exertion (RPE) multiply by 10 to estimate heart rate. Subjective evaluation
Subjective evaluation • Body discomfort map • Body portions
Body discomfort scales • Discomfort scale • Borg • Category partitioning • See table 6.9, pg. 102
Relative and absolute scales • Semantic differential (absolute scale) • Rate aspects of the workspace, methods, etc. on a scale between 2 opposite adjectives, • e.g. comfortable ___ : ___ : ___ : ___ : ___ : ___ : ___ uncomfortable spacious ___ : ___ : ___ : ___ : ___ : ___ : ___ cramped • Alternatively, choose one adjective (acceptable, comfortable, etc.) and evaluate several aspects of the workplace, methods, etc. on that one objective • e.g., acceptability, comfort, etc.
Relative and absolute scales • Paired votes (relative) • Compare two alternatives on a relative ranking scale, • e.g., Prefer notes using Sympodium (A) or SmartBoard (B) Indicate degree of preference
Related concepts • Evolutionary Operation of Processes (EVOP) • Designed series of experiments to evaluate the effects on the output of the process of changing specific variables • Key idea is to make changes while the process is active (i.e., not as a separate experiment) • Substitute number of runs for strict control • Project scheduling • CPM • PERT