Download

1 / 29
290 likes | 434 Views
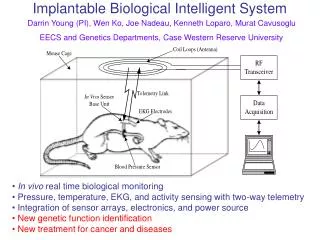
Towards Real-time Safety Monitoring of Medical Products. Xiaochun Li MBSW May 24, 2010. BACKGROUND

E N D
Towards Real-time Safety Monitoring of Medical Products Xiaochun Li MBSW May 24, 2010
BACKGROUND • In the fall of 2007, Congress passed the FDA Amendments Act (FDAAA), mandating FDA to establish an active surveillance system for monitoring drugs, using electronic data from healthcare information holders. The Sentinel Initiative is FDA’s response to that mandate. Its goal is to build and implement a new active surveillance system that will eventually be used to monitor all FDA-regulated products. • Goal - to create a linked, sustainable system -- the Sentinel System--that will draw on existing automated healthcare data from multiple sources to actively monitor the safety of medical products continuously and in real-time
Real time Sentinel System with healthcare data from multiple sources entails • Standardized data structure – a common data model (CDM) • Analytical methods that run on CDMs
Observational Medical Outcomes Partnership (OMOP) • OMOP Objectives • To determine the feasibility of assembling the required data into an infrastructure that enables active, systematic monitoring of observational data • To determine value of using observational data to identify and evaluate the safety and benefits of prescription drugs, as a supplement to currently available tools • To test required governance structures A public-private partnership to serve the public health by testing whether multi-source observational data can improve our ability to assess drug safety and benefits. The design was developed through a Public-Private Partnership among industry, FDA and FNIH. Page 4
Testing data models:OMOP data community OMOP Extended Consortium OMOP Research Core Humana PartnersHC Regenstrief Research Lab Centralized data Thomson Reuters GE i3 Drug Safety SDI Federalpartners Distributed Network
Common Data Model The common data model includes: A single data schema that can be applied to disparate data types Standardized terminologies Consistent transformation for key data elements A common data model can: Enable consistent and systematic application of analysis methods to produce comparable results across sources Create a community to facilitate the sharing of tools and practices Impose data quality standards Create implementation efficiencies
Common data model Using standardized terminologies for representing • drugs • conditions • procedures
Observational Medical Dataset Simulator: OSIM Implementation by ProSanos Corporation • Capable of generating 1 to 100,000,000+ persons • Two types of output files: • Simulated Drug & Condition Files:including attributes used to model confounding (provides “answer key” for analytic research) • Hypothetical Person Files: longitudinal record of drug exposures and condition occurrences • Data characteristics and confounding controlled by input probability distributions • Confounding variables age, gender, race, indication introduced as risk factors for select drugs & conditions • Default distributions produced from analysis of real observational data; can be modified by user • Format of Hypothetical Person Files conforms to OMOP Common Data Model
Present Status • OMOP Research Core completed transformation of 5 central databases into common data model • Thomson MedStat- Commercial • Thomson MedStat- Medicare • Thomson MedStat- Medicaid • Thomson MedStat- Lab • GE Centricity • OMOP Research Team made publicly available: • Final Common data model specification document • Program code for instantiating common data model tables • Transformation documentation and source code for central datasets • Procedure code for constructing eras from drug and condition tables • Standardized terminology and source mapping tables (ICD9->MedDRA) • OMOP community (Distributed Partners, Federal Collaborators, Extended Consortium) have implemented or are implementing common data model to their data sources • Feedback lessons learned • Contribute to open-source library of tools for data transformation • All analysis methods have been developed for the common data model
OMOP analysis domains Hypothesis Generating Hypothesis Strengthening Identification of non-specified conditions Evaluation of a drug-condition association Monitoring of Health Outcomes of Interest Identification of non-specified associations: This exploratory analysis aims to generate hypotheses from observational data by identifying associations between drugs and conditions for which the relationships were previously unknown. This type of analysis is likely to be considered an initial step of a triaged review process, where many drug-outcome pairs are simultaneously explored to prioritize the drugs and outcomes that warrant further attention. Monitoring of Health Outcomes of Interest: The goal of this surveillance analysis is to monitor the relationship between a series of drugs and specific outcomes of interest. These analyses require an effective definition of the events of interest in the context of the available data.
Methods testing strategy:Monitoring of Health Outcomes of Interest • Each method is implemented in the OMOP Research Lab against the central databases • Method feasibility will be tested across the OMOP data network • Methods performance tested two ways • Identifying drug-condition associations within an entire observational dataset • Identifying drug-condition associations as data accumulates over time • Evaluation focuses on degree to which method maximizes ‘true positives’ while minimizing ‘false positives’ • Monitoring of Health Outcomes of Interest studies for each method will explore 10 HOIs for 10 drugs (100 experiments per data cut)
HSIUHighthroughput Safety-screening by IU IU OMOP Method Team Siu Hui Xiaochun Li Changyu Shen Yan (Cindy) Ding Deming Mi
Challenges • The hypothesis generation of testing all by all (e.g., 4000x5000) drug-condition associations in large databases (eg 10 million patients) presents a unique challenge • A practically useful approach will need to balance accuracy and efficiency • False positive control is important
Proposed approach • A cohort analysis perspective • Selection of controls • Two versions of “event” • Confounding adjustment • False positive control
Count and intensity based analyses Count based Intensity based Association can be assessed by Chi-square, Odds ratio, relative risk and risk difference Association can be assessed by Chi-square, intensity density ratio and Intensity density difference. Note for unexposed, the length of exposure is the sum of exposure of all drugs
Selection of controls • The control group - subjects who did not take the medication being studied and had at least one other medication • The exposed and control groups are more comparable • Likely to reduce false positive • Substantially increase computation cost • Alternative is to include everyone as control, i.e. the population norm
Definition of event (exposed) The “in” version The “after” version The event Y occurs after the first prescription of drug A • The event Y occurs during any exposure period of drug A A A A Y A 1 A A A Y A 1 A Y A A Y A 1 A Y A A Y A 1 A A Y A A 0 A A Y A A 1 Y A A A A 0 Y A A A A 0 Time Time
Definition of event (control) The “in” version The “after” version The event Y occurs after the earliest prescription of ANY drug • The event Y occurs during any exposure period of ANY drug B B B Y B 1 B B B Y B 1 B Y B C Y C 1 B Y B C Y C 1 C C Y D D 0 C C Y D D 1 Y B B B B 0 Y B B C C 0 Time Time
Adjustment of confounding • Stratification with continuous variables transformed to categorical variables first • We will consider age, gender and number of medications • The advantage of stratification - automatically generates sub-group analysis • Stratification is compatible with the parallel computing where data are divided into subsets to run parallel (data parallelization) • For drug-condition pairs with strong signal, further sensitivity analysis can be used to assess possible bias induced by uncontrolled confounding
False positives/negatives • Multiple-comparison issue for assessment of many drug-condition pairs • False discovery rate (FDR) as a quantitative measure for false positive control • We plan to implement the local FDR procedure (Efron, 2000) • True association status is a latent binary variable • Model the distributions of true and false positives (mixture model) • Both parametric and non-parametric methods are straight forward • Probabilistic measure of likelihood of true association for each pair
Computation • We implemented our method in SAS • Programs need to balance actual computation and data access to optimize performance (i.e. storage of large amount of intermediate data avoids redundant computation, but access of large data also costs time) • Modularize programs to allow flexible functionality • Easily incorporate new data to update results
Computational Issues • Large number of patients • Large number of combinations of drugs and conditions • Need efficient algorithms • for counting events • for calculation of length of exposure to a specific drug, or to any drug • Identification of bottleneck(s) for efficiency improvement
Computing Lessons Learned • Pre-indexing is important for fast query/access of data • Identification of unique drug list of the synthetic data by SAS took 6 min before indexing and less than 1 sec after indexing • Batching (by patients) saves memory • Program optimization can reduce computation time by 90% • Avoid redundant computations • Appropriate data structure to avoid storage of large amount of trivial data (i.e. large number of zero count) • Parallel computing • Data parallelization – single set of instructions on different parts of data • Parallel computing using SAS/CONNECT reduces the computing time of 10,000 patients by ~70% on OMOP stat server • Effort is still on-going
Where we are now Methods implemented in SAS • unstratified analysis • stratified (by age, sex and number of drugs) analysis Methods in queue to be tested by OMOP
Lessons Learned • Implementation of relatively straight forward method might not be so straight forward in giant databases • Hardware and software co-ordination is a key for successful execution of the method and enhancement of speed. It will also take a series of trial-and-error experiments to identify the optimal setting. • Need to work closely with OMOP to achieve clear mutual understanding of needs from both sides at strategic and tactic levels