Download
1 / 1
10 likes | 111 Views
Assay of Mercaptopurine, Thioguanine and Azathioprine in Pharmaceuticals by Capillary Zone Electrophoresis. Yu-Hsiang Ho a , Chung-Ta Li a , Shou-Mei Wu a,b * a Faculty of Pharmacy, College of Pharmacy, Kaohsiung Medical University, Kaohsiung, Taiwan.

E N D
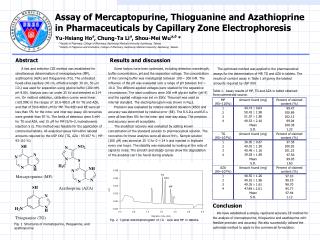
Assay of Mercaptopurine, Thioguanine and Azathioprine in Pharmaceuticals by Capillary Zone Electrophoresis Yu-Hsiang Hoa, Chung-Ta Lia, Shou-Mei Wua,b * a Faculty of Pharmacy, College of Pharmacy, Kaohsiung Medical University, Kaohsiung, Taiwan. b Faculty of Fragrance and Cosmetics, College of Pharmacy, Kaohsiung Medical University, Kaohsiung, Taiwan. Abstract A fast and selective CZE method was established for simultaneous determination of mercaptopurine (MP), azathioprine (AZA) and thioguanine (TG). The untreated fused-silica capillary (40 cm, effective length 30 cm, 50 m I.D.) was used for separation using glycine buffer (200 mM, pH 9.00). Analysis was run under 25 kV and detected at 214 nm. On method validation, calibration curves were linear (r≧0.999) in the ranges of 20.0-400.0 M for TG and AZA, and that of 50.0-400.0 M for MP. The RSD and RE were all less than 5% for the intra- and inter-day assay. All recoveries were greater than 97 %. The limits of detection were 5 mM for TG and AZA, and 15 M for MP (S/N=3, hydrodynamic injection 5 s). This method was feasible for the application of commercial tablets. All analytical values fell within labeled amounts required by the USP XXV. (TG, AZA : 93-107 % ; MP : 93-110 %) Results and discussion Some factors have been optimized, including detection wavelength, buffer concentration, pH and the separation voltage. The concentration of the running buffer was investigated between 100 ~ 300 mM. The influence of the pH was evaluated over a range of pH between 8.0 ~ 10.0. The different applied voltages were studied for the separative circumstance. The ideal conditions were 200 mM glycine buffer (pH 9) and the applied voltage was set on 25kV. Thiouracil was used as internal standard. The electropherogram was shown in Fig.2. Precision was evaluated by relative standard deviation (RSD) and accuracy was determined by relative error (RE). The R.S.D.s and R.E.s were all less than 5% for the intra- and inter-day assay. The precision and accuracy were all acceptable. The analytical recovery was evaluated by adding known concentration of the standard solution to pharmaceutical solution. The recoveries for these analytes were all above 94%. Sample solution(200 M) was stored at 25 ℃ for 0 ~ 24 h and injected in triplicate every one hours. The stability was evaluated by looking at the ratio of signal to noise. The smooth and steady curves show the degradation of the analytes can’t be found during analysis. The optimized method was applied to the pharmaceutical assays for the determination of MP, TG and AZA in tablets. The results of content assay in Table 1 all giving the labeled amounts required by USP XXV. Table 1. Assay results of MP, TG and AZA in tablet obtained from commercial source. Conclusion We have established a simple, rapid and accuracy CE method for the analysis of mercaptopurine, thioguanine and azathioprine with feasible precision and accuracy. We also successfully utilized the optimized method to apply to the commercial formulation. Fig. 2 Typical electropherogram of TG、AZA and MP in tablets. Fig. 1 Structures of mercatopurine, thioguanine, and azathiopurine.