Download
1 / 33
330 likes | 469 Views
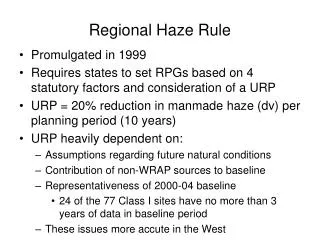
Regional Haze is a Complex 8-Dimensional Problem Aerosol Concentrations x Compositions x Size Distributions x Optical Properties x Latitude x Longitude x Altitude x Time, IMPROVE Data provide Site-Specific Information on Concentrations & Compositions at the Surface,

E N D
Regional Haze is a Complex 8-Dimensional Problem • Aerosol Concentrations x Compositions x Size Distributions x Optical Properties x Latitude x Longitude x Altitude x Time, • IMPROVE Data provide Site-Specific Information on Concentrations & Compositions at the Surface, • But Information on Particle Size, Optical Properties, (3D) Spatial Patterns & Temporal Patterns is limited. • Sources of Supplemental Regional Haze-Related Data • Collected, Archived & Distributed (with Other Objectives) • Large Spatial Coverage (National - Global) • High Spatial and/or Temporal Resolution • “Extractable Information Content”: Space, Time, Size, Optics, etc.
Collected, Distributed & Archived with Other Objectives • Large Domain Spatial Coverage (National - Global) • High Spatial and/or Temporal Resolution • Info on Aerosols: Space, Time, Size & Optical Properties
IMPROVE Northeast Sulfate Event July 17, 1999 (Data available from VIEWS about 1 Year after Event) NAAPS Forecast Sulfate Aerosol July 17, 1999 Data Available from NRL about 5 Days Before Event)
NAAPS Model “Data” for (near) Lye Brook IMPROVE site, July ’99 Sulfate Time Series and Vertical Profile, Remodeled with Emissions Reductions (“Greater Midwest” includes parts of Mane-VU, VISTAS, CENRAP & MRPO)
Are There Areas of Common Interest between NRL & RPOs? NAAPS Model is a “Work in Progress”: - For 7/17/99, SO4 formation Underestimated, - Smoke & Dust Emissions Need Improvement, - “Ground Truth” Evaluation & Verification? Under-estimates SO4 Over-estimates SO2 NAAPS Model Group - “Our Current Work”:1. Improve the dust source function 2. Verify the sulfate simulations 3. Identify/implement daily global smoke emissions 4. Improve the microphysics & chemistry.” Sum is Just About Right
Assessing Air Quality Using USDA Shadow-band RadiometersJames SlusserUSDA UV-B Monitoring and Research ProgramNatural Resource Ecology LaboratoryColorado State University http://uvb.nrel.colostate.edu/UVB/home_page.html
Purposes of USDA UVB Monitoring and Research Program • Furnishes basic information necessary to support research on potential damaging effects of UVB on agriculture, forests, and livestock • Provides UV climatology data to agricultural and scientific researchers • Supplies ground truth for satellite retrievals and model development • Establishes long-term record of UVB to assess trends
Three measures of aerosol and smoke loading: Aerosol optical depth(AOD) quantifies the attenuation of the direct Solar beam. The AOD is proportional to total column loading of particles of the same size and related to visibility. (Increases as Bext Increases [vertically]) Angstrom exponent (alpha) gives the wavelength dependence of the AOD. Large particles (such as cloud drops or ice crystals) are spectrally neutral (alpha close to 0). The very smallest particles , molecules, have an inverse (wavelength) to the fourth dependence (alpha equal to 4). Most aerosols have alpha between 1 and 3. (Increases as Particle Size Decreases) Single scattering albedo (SSA) is the ratio of scattering to scattering plus absorption. For non absorbing (sulfate and water) particles SSA equals 1.0. Aerosols with black carbon have SSA between 0.7 and 0.9. (Decreases as Particle Absorption Increases)
Direct, Indirect (Scattered), & Total Solar Radiation Available for 12 Wavelength Bands, 3-Minute Time Resolution For about 35 sites, Distributed throughout US & S. Canada Updated Near-Real Time, every 24 hours
Wavelength-Specific Aerosol Optical Depth at Beltsville, MD for Sulfate Event and Clear Day in early July, 2002
Wavelength-Specific Aerosol Optical Depth at Beltsville, MD for beginning of Quebec Fire Smoke Event July 7, 2002 (note Saturation for shorter wavelenths starting 12:00)
Sulfate Event Beltsville, MD 7/17/99 Most Radiation Diffuse, but Small Reduction of Total High AOD = High Bext (vertically) Single Scat. Albedo = 1, indicates non-adsorbing (scattering-only) aerosol. Decreasing Angstrom exp. = Increasing Particle Size
Smoke Event Baton Rouge, LA 5/15/98 Most Radiation Diffuse, & Large Reduction of Total High AOD = High Bext (vertically) Angstrom exp. > 1 = Small Particle Size. Single Scat. Albedo < 1, indicates adsorbing (and scattering) aerosol.
Logistics • Basic cost around $12,500 • Requires 110 VAC and phone line OR batteries and memory card • Can be polled in real time as Web site • Calibration is established in situ during clear days • Wind and ancillary instruments can be logged as well • USDA would be willing to assist with data analysis on a per cost basis
Are There Areas of Common Interest between USDA-UVB & RPOs? • Visible Shadow-band radiometers provide aerosol and cloud information critical to forest fire and air quality studies. • Low cost ($12.5K) and automated operation are attractive features. • This method provides fine temporal resolution useful for studying smoke and pollution plumes. • Ancillary information (e.g. T, RH, wind speed and direction) can be logged simultaneously. • USDA would be glad to work with State and Federal agencies on data analysis (would require about 0.5 FTE for “routine” data processing).
The ASOS Visibility Sensor • The ASOS visibility sensor is a forward scattering instrument • Replaced Hourly Human Observers in about 1995-96 • “Better Quality” Extinction Data, But Need QA and Archived Data are Averaged, Binned, Truncated (Need Direct Access & Routine Processing)
ASOS Stations from FAA, NWS and Archived at NCDC For this analysis (Husar, 2002) data for 220 stations were available from NCDC These ASOS sites are mostly NWS sites, uniformly distributed over the country (Imagine if we could get the entire set, including the DOD sites, not listed).
Comparison of Sites with Duplicate ASOS Sensors • Co-located ASOS sensors are installed at different runways of the same airport. • Dual ASOS sensors (55) are distributed uniformly over the 800+ station network • Triple sensors are particularly useful for sensor calibration and consistency checking
Duplicate Sensors: Good Sites Dallas-FW, TX Erie, PA San Diego, CA Houston, TX • At several duplicate sites the 2-sensor correlation is excellent and the absolute values also match. • This indicates that the scattering sensor per se has high precision and temporal stability.
Albuquerque, NM Duluth, MN Albuquerque, NM Duplicate Sensors:Poor Sites • Duplicate sensors at some sites show significant deviation in scale and offset. • The nature of these deviations indicate poor instrument calibration maintenance for the ASOS visibility sensors.
ASOS Bext Threshold: 0.05 km(-1) • The Bext values below 0.05 km-1 are reported as 0.05. • For Koschmieder coeff K=3.9, this threshold VR=78km(~ 50 mile); for K=2 VR=40km(~25mi) • In the pristine SW US, the ASOS threshold distorts the “cleaner day” data • Over the East and West, the (raw data) ASOS signal is well over the threshold most of the time (although Archived data are Truncated at 10 mi.)
Typical Diurnal Pattern of Bext, Temperature & Dewpoint • Typically, Bext shows a strong nighttime peak due to high relative humidity. • Most of the increase is due to water absorption by hygroscopic aerosols. At RH >90% , the aerosol is mostly water • At RH < 90%, the Bext is mostly influenced by the dry aerosol content; the RH effect can be corrected. Macon, GA, Jul 24, 2000
Adopted RH Correction Curve(To be validated for different locations/seasons) RH is calculated from T – Temperature, deg C and D – Dewpoint, deg C RH = 100*((112-(0.1*T)+D)/(112+(0.9*T)))8 • The ASOS Bext value are filtered & adjusted for high humidity • Values at RH >= 90% are not used • The Bext is also corrected for RH: RHCorrBext = Bext/RHFactor
Seasonal Average Diurnal Bext Pattern • For each minute of the day, the data were averaged over June, July and August, 2000 • Average Bext was calculated for • Raw, as reported • For data with RH < 90% • RH < 90% and RH Corrected • Based on the three values, the role of water can be estimated for each location
Location of ASOS and Nearby Hourly PM2.5 Sites • There are no co-located ASOS and PM2.5 sites • The stations are not co-located but in the same city • Hourly PM2.5 data are compared to the filtered and RH-corrected one minute Bext
ASOS-Hourly PM2.5 Allentown, PA • RH-Adjusted Bext is a good surrogate for PM-2.5, and • RH-Screened Bext is good surrogate for PM-2.5 + H2O
Des Moines, IA Grand Rapids, MI
Islip, Long Island, NY San Diego, CA
Are There Areas of Common Interest between ASOS Data Providers & RPOs? • ASOS Sites are Spatially Dense (1000 sites), Evenly Distributed (airports everywhere “just out of town”, and Have High Temporal Resolution • Currently Archived Data are Averaged (1-hour), Truncated (at >= 10 miles) and Binned (into VR categories < 10 mi.) but, • Are Useful for evaluating Episodes, even in their current form, but • Require “Expert Processing” to extract “aerosol & haze-relevant Info, and • Could be extraordinarily Useful if: • We could access them in near-real time (& historical), • In their raw, uncensored form (1-minute uncensored Bext + RH), • From any & all sites, and Processed for Haze-Relevant Info, and • Merge them with other Haze-Related data…
For those interested in direct access to the data from the USDA-UVB network, the URL is: http://uvb.nrel.colostate.edu/UVB/home_page.html For those interested in additional detail on the potential haze & aerosol information content of this data, Jim Slusser, who directs this UVB network has posted additional slides at: ftp://uvb.nrel.colostate.edu/pub Grab the file: dallas_airqual_02.ppt."