Download
1 / 221
2.21k likes | 2.23k Views
Explore the percentage trends of high school students regarding seat belt use, riding with a drinking driver, driving under the influence, texting while driving, and carrying weapons from 1995 to 2017 in Missouri based on the Youth Risk Behavior Survey (YRBS) data. The analysis includes sex, grade, and race/ethnicity breakdowns to provide insights into these risky behaviors among students.

E N D
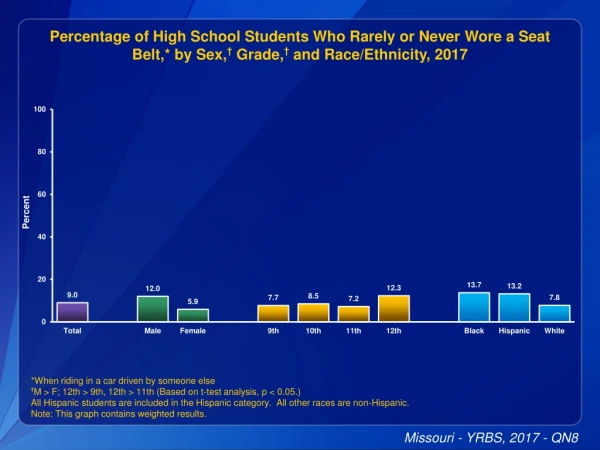
Percentage of High School Students Who Rarely or Never Wore a Seat Belt,* by Sex,† Grade,† and Race/Ethnicity, 2017 *When riding in a car driven by someone else †M > F; 12th > 9th, 12th > 11th (Based on t-test analysis, p < 0.05.) All Hispanic students are included in the Hispanic category. All other races are non-Hispanic. Note: This graph contains weighted results. Missouri - YRBS, 2017 - QN8
Percentage of High School Students Who Rarely or Never Wore a Seat Belt,* 1995-2017† *When riding in a car driven by someone else †Decreased 1995-2017, decreased 1995-2005, decreased 2005-2017 [Based on linear and quadratic trend analyses using logistic regression models controlling for sex, race/ethnicity, and grade (p < 0.05). Significant linear trends (if present) across all available years are described first followed by linear changes in each segment of significant quadratic trends (if present).] Data not available for 2011. Note: This graph contains weighted results. Missouri - YRBS, 1995-2017 - QN8
Percentage of High School Students Who Rode with a Driver Who Had Been Drinking Alcohol,* by Sex, Grade, and Race/Ethnicity,† 2017 *In a car or other vehicle, one or more times during the 30 days before the survey †H > W (Based on t-test analysis, p < 0.05.) All Hispanic students are included in the Hispanic category. All other races are non-Hispanic. Note: This graph contains weighted results. Missouri - YRBS, 2017 - QN9
Percentage of High School Students Who Rode with a Driver Who Had Been Drinking Alcohol,* 1995-2017† *In a car or other vehicle, one or more times during the 30 days before the survey †Decreased 1995-2017 [Based on linear and quadratic trend analyses using logistic regression models controlling for sex, race/ethnicity, and grade (p < 0.05). Significant linear trends (if present) across all available years are described first followed by linear changes in each segment of significant quadratic trends (if present).] Data not available for 2011. Note: This graph contains weighted results. Missouri - YRBS, 1995-2017 - QN9
Percentage of High School Students Who Drove a Car or Other Vehicle When They Had Been Drinking Alcohol,* by Sex, Grade,† and Race/Ethnicity, 2017 *One or more times during the 30 days before the survey, among students who had driven a car or other vehicle during the 30 days before the survey †12th > 9th (Based on t-test analysis, p < 0.05.) All Hispanic students are included in the Hispanic category. All other races are non-Hispanic. Missing bar indicates fewer than 100 students in this subgroup. Note: This graph contains weighted results. Missouri - YRBS, 2017 - QN10
Percentage of High School Students Who Drove a Car or Other Vehicle When They Had Been Drinking Alcohol,* 2013-2017† *One or more times during the 30 days before the survey, among students who had driven a car or other vehicle during the 30 days before the survey †Decreased 2013-2017 [Based on linear trend analyses using logistic regression models controlling for sex, race/ethnicity, and grade (p < 0.05).] Note: This graph contains weighted results. Missouri - YRBS, 2013-2017 - QN10
Percentage of High School Students Who Texted or E-Mailed While Driving a Car or Other Vehicle,* by Sex, Grade,† and Race/Ethnicity, 2017 *On at least 1 day during the 30 days before the survey, among students who had driven a car or other vehicle during the 30 days before the survey †10th > 9th, 11th > 9th, 11th > 10th, 12th > 9th, 12th > 10th, 12th > 11th (Based on t-test analysis, p < 0.05.) All Hispanic students are included in the Hispanic category. All other races are non-Hispanic. Missing bar indicates fewer than 100 students in this subgroup. Note: This graph contains weighted results. Missouri - YRBS, 2017 - QN11
Percentage of High School Students Who Texted or E-Mailed While Driving a Car or Other Vehicle,* 2013-2017† *On at least 1 day during the 30 days before the survey, among students who had driven a car or other vehicle during the 30 days before the survey †No change 2013-2017 [Based on linear trend analyses using logistic regression models controlling for sex, race/ethnicity, and grade (p < 0.05).] Note: This graph contains weighted results. Missouri - YRBS, 2013-2017 - QN11
Percentage of High School Students Who Carried a Weapon,* by Sex,† Grade,† and Race/Ethnicity,† 2017 *Such as a gun, knife, or club, on at least 1 day during the 30 days before the survey †M > F; 11th > 9th, 12th > 9th; W > B (Based on t-test analysis, p < 0.05.) All Hispanic students are included in the Hispanic category. All other races are non-Hispanic. Note: This graph contains weighted results. Missouri - YRBS, 2017 - QN12
Percentage of High School Students Who Carried a Weapon,* 1995-2017† *Such as a gun, knife, or club, on at least 1 day during the 30 days before the survey †Decreased, 1995-2003, increased, 2003-2017 [Based on linear and quadratic trend analyses using logistic regression models controlling for sex, race/ethnicity, and grade (p < 0.05). Significant linear trends (if present) across all available years are described first followed by linear changes in each segment of significant quadratic trends (if present).] Data not available for 2011. Note: This graph contains weighted results. Missouri - YRBS, 1995-2017 - QN12
Percentage of High School Students Who Carried a Weapon on School Property,* by Sex,† Grade, and Race/Ethnicity, 2017 *Such as a gun, knife, or club, on at least 1 day during the 30 days before the survey †M > F (Based on t-test analysis, p < 0.05.) All Hispanic students are included in the Hispanic category. All other races are non-Hispanic. Note: This graph contains weighted results. Missouri - YRBS, 2017 - QN13
Percentage of High School Students Who Carried a Weapon on School Property,* 2015-2017† *Such as a gun, knife, or club, on at least 1 day during the 30 days before the survey †No change 2015-2017 [Based on linear trend analyses using logistic regression models controlling for sex, race/ethnicity, and grade (p < 0.05).] Note: This graph contains weighted results. Missouri - YRBS, 2015-2017 - QN13
Percentage of High School Students Who Did Not Go to School Because They Felt Unsafe at School or on Their Way to or from School,* by Sex, Grade, and Race/Ethnicity, 2017 *On at least 1 day during the 30 days before the survey All Hispanic students are included in the Hispanic category. All other races are non-Hispanic. Note: This graph contains weighted results. Missouri - YRBS, 2017 - QN15
Percentage of High School Students Who Did Not Go to School Because They Felt Unsafe at School or on Their Way to or from School,* 2015-2017† *On at least 1 day during the 30 days before the survey †No change 2015-2017 [Based on linear trend analyses using logistic regression models controlling for sex, race/ethnicity, and grade (p < 0.05).] Note: This graph contains weighted results. Missouri - YRBS, 2015-2017 - QN15
Percentage of High School Students Who Were in a Physical Fight,* by Sex,† Grade,† and Race/Ethnicity, 2017 *One or more times during the 12 months before the survey †M > F; 9th > 12th (Based on t-test analysis, p < 0.05.) All Hispanic students are included in the Hispanic category. All other races are non-Hispanic. Note: This graph contains weighted results. Missouri - YRBS, 2017 - QN17
Percentage of High School Students Who Were Ever Physically Forced to Have Sexual Intercourse,* by Sex,† Grade, and Race/Ethnicity, 2017 *When they did not want to †F > M (Based on t-test analysis, p < 0.05.) All Hispanic students are included in the Hispanic category. All other races are non-Hispanic. Note: This graph contains weighted results. Missouri - YRBS, 2017 - QN19
Percentage of High School Students Who Were Ever Physically Forced to Have Sexual Intercourse,* 2001-2017† *When they did not want to †No change 2001-2017 [Based on linear and quadratic trend analyses using logistic regression models controlling for sex, race/ethnicity, and grade (p < 0.05). Significant linear trends (if present) across all available years are described first followed by linear changes in each segment of significant quadratic trends (if present).] Data not available for 2011. Note: This graph contains weighted results. Missouri - YRBS, 2001-2017 - QN19
Percentage of High School Students Who Experienced Physical Dating Violence,* by Sex, Grade, and Race/Ethnicity, 2017 *Being physically hurt on purpose by someone they were dating or going out with [counting such things as being hit, slammed into something, or injured with an object or weapon] one or more times during the 12 months before the survey, among students who dated or went out with someone during the 12 months before the survey All Hispanic students are included in the Hispanic category. All other races are non-Hispanic. Missing bar indicates fewer than 100 students in this subgroup. Note: This graph contains weighted results. Missouri - YRBS, 2017 - QN22
Percentage of High School Students Who Experienced Physical Dating Violence,* 2013-2017† *Being physically hurt on purpose by someone they were dating or going out with [counting such things as being hit, slammed into something, or injured with an object or weapon] one or more times during the 12 months before the survey, among students who dated or went out with someone during the 12 months before the survey †No change 2013-2017 [Based on linear trend analyses using logistic regression models controlling for sex, race/ethnicity, and grade (p < 0.05).] Note: This graph contains weighted results. Missouri - YRBS, 2013-2017 - QN22
Percentage of High School Students Who Were Bullied on School Property,* by Sex,† Grade,† and Race/Ethnicity, 2017 *Ever during the 12 months before the survey †F > M; 9th > 12th, 10th > 12th, 11th > 12th (Based on t-test analysis, p < 0.05.) All Hispanic students are included in the Hispanic category. All other races are non-Hispanic. Note: This graph contains weighted results. Missouri - YRBS, 2017 - QN23
Percentage of High School Students Who Were Bullied on School Property,* 2009-2017† *Ever during the 12 months before the survey †No change 2009-2017 [Based on linear trend analyses using logistic regression models controlling for sex, race/ethnicity, and grade (p < 0.05).] Data not available for 2011. Note: This graph contains weighted results. Missouri - YRBS, 2009-2017 - QN23
Percentage of High School Students Who Were Electronically Bullied,* by Sex,† Grade,† and Race/Ethnicity, 2017 *Counting being bullied through texting, Instagram, Facebook, or other social media, ever during the 12 months before the survey †F > M; 11th > 10th (Based on t-test analysis, p < 0.05.) All Hispanic students are included in the Hispanic category. All other races are non-Hispanic. Note: This graph contains weighted results. Missouri - YRBS, 2017 - QN24
Percentage of High School Students Who Were Electronically Bullied,* 2015-2017† *Counting being bullied through texting, Instagram, Facebook, or other social media, ever during the 12 months before the survey †No change 2015-2017 [Based on linear trend analyses using logistic regression models controlling for sex, race/ethnicity, and grade (p < 0.05).] Note: This graph contains weighted results. Missouri - YRBS, 2015-2017 - QN24
Percentage of High School Students Who Felt Sad or Hopeless,* by Sex,† Grade,† and Race/Ethnicity, 2017 *Almost every day for >=2 weeks in a row so that they stopped doing some usual activities, ever during the 12 months before the survey †F > M; 11th > 9th, 11th > 10th, 11th > 12th (Based on t-test analysis, p < 0.05.) All Hispanic students are included in the Hispanic category. All other races are non-Hispanic. Note: This graph contains weighted results. Missouri - YRBS, 2017 - QN25
Percentage of High School Students Who Felt Sad or Hopeless,* 1999-2017† *Almost every day for >=2 weeks in a row so that they stopped doing some usual activities, ever during the 12 months before the survey †Increased 1999-2017 [Based on linear and quadratic trend analyses using logistic regression models controlling for sex, race/ethnicity, and grade (p < 0.05). Significant linear trends (if present) across all available years are described first followed by linear changes in each segment of significant quadratic trends (if present).] Data not available for 2011. Note: This graph contains weighted results. Missouri - YRBS, 1999-2017 - QN25
Percentage of High School Students Who Seriously Considered Attempting Suicide,* by Sex,† Grade, and Race/Ethnicity, 2017 *Ever during the 12 months before the survey †F > M (Based on t-test analysis, p < 0.05.) All Hispanic students are included in the Hispanic category. All other races are non-Hispanic. Note: This graph contains weighted results. Missouri - YRBS, 2017 - QN26
Percentage of High School Students Who Seriously Considered Attempting Suicide,* 1995-2017† *Ever during the 12 months before the survey †Decreased 1995-2017, decreased 1995-2013, increased 2013-2017 [Based on linear and quadratic trend analyses using logistic regression models controlling for sex, race/ethnicity, and grade (p < 0.05). Significant linear trends (if present) across all available years are described first followed by linear changes in each segment of significant quadratic trends (if present).] Data not available for 2011. Note: This graph contains weighted results. Missouri - YRBS, 1995-2017 - QN26
Percentage of High School Students Who Made a Plan About How They Would Attempt Suicide,* by Sex, Grade,† and Race/Ethnicity,† 2017 *During the 12 months before the survey †11th > 9th, 11th > 10th; W > B (Based on t-test analysis, p < 0.05.) All Hispanic students are included in the Hispanic category. All other races are non-Hispanic. Note: This graph contains weighted results. Missouri - YRBS, 2017 - QN27
Percentage of High School Students Who Made a Plan About How They Would Attempt Suicide,* 1995-2017† *During the 12 months before the survey †Decreased 1995-2017, decreased 1995-2007, increased 2007-2017 [Based on linear and quadratic trend analyses using logistic regression models controlling for sex, race/ethnicity, and grade (p < 0.05). Significant linear trends (if present) across all available years are described first followed by linear changes in each segment of significant quadratic trends (if present).] Data not available for 2011. Note: This graph contains weighted results. Missouri - YRBS, 1995-2017 - QN27
Percentage of High School Students Who Attempted Suicide,* by Sex, Grade, and Race/Ethnicity, 2017 *One or more times during the 12 months before the survey All Hispanic students are included in the Hispanic category. All other races are non-Hispanic. Note: This graph contains weighted results. Missouri - YRBS, 2017 - QN28
Percentage of High School Students Who Attempted Suicide,* 1995-2017† *One or more times during the 12 months before the survey †Decreased, 1995-1999, no change, 1999-2017 [Based on linear and quadratic trend analyses using logistic regression models controlling for sex, race/ethnicity, and grade (p < 0.05). Significant linear trends (if present) across all available years are described first followed by linear changes in each segment of significant quadratic trends (if present).] Data not available for 2011. Note: This graph contains weighted results. Missouri - YRBS, 1995-2017 - QN28
Percentage of High School Students Who Had a Suicide Attempt That Resulted in an Injury, Poisoning, or Overdose That Had to Be Treated by a Doctor or Nurse,* by Sex, Grade, and Race/Ethnicity, 2017 *During the 12 months before the survey All Hispanic students are included in the Hispanic category. All other races are non-Hispanic. Note: This graph contains weighted results. Missouri - YRBS, 2017 - QN29
Percentage of High School Students Who Had a Suicide Attempt That Resulted in an Injury, Poisoning, or Overdose That Had to Be Treated by a Doctor or Nurse,* 1995-2017† *During the 12 months before the survey †Decreased, 1995-2001, no change, 2001-2017 [Based on linear and quadratic trend analyses using logistic regression models controlling for sex, race/ethnicity, and grade (p < 0.05). Significant linear trends (if present) across all available years are described first followed by linear changes in each segment of significant quadratic trends (if present).] Data not available for 2011. Note: This graph contains weighted results. Missouri - YRBS, 1995-2017 - QN29
Percentage of High School Students Who Ever Tried Cigarette Smoking,* by Sex, Grade,† and Race/Ethnicity,† 2017 *Even one or two puffs †11th > 9th; H > B, W > B (Based on t-test analysis, p < 0.05.) All Hispanic students are included in the Hispanic category. All other races are non-Hispanic. Note: This graph contains weighted results. Missouri - YRBS, 2017 - QN30
Percentage of High School Students Who Ever Tried Cigarette Smoking,* 1995-2017† *Even one or two puffs †Decreased 1995-2017 [Based on linear and quadratic trend analyses using logistic regression models controlling for sex, race/ethnicity, and grade (p < 0.05). Significant linear trends (if present) across all available years are described first followed by linear changes in each segment of significant quadratic trends (if present).] Data not available for 2011. Note: This graph contains weighted results. Missouri - YRBS, 1995-2017 - QN30
Percentage of High School Students Who First Tried Cigarette Smoking Before Age 13 Years,* by Sex, Grade,† and Race/Ethnicity, 2017 *Even one or two puffs †9th > 12th, 10th > 12th (Based on t-test analysis, p < 0.05.) All Hispanic students are included in the Hispanic category. All other races are non-Hispanic. Note: This graph contains weighted results. Missouri - YRBS, 2017 - QN31
Percentage of High School Students Who Currently Smoked Cigarettes,* by Sex, Grade,† and Race/Ethnicity,† 2017 *On at least 1 day during the 30 days before the survey †11th > 9th, 12th > 9th, 12th > 10th; W > B (Based on t-test analysis, p < 0.05.) All Hispanic students are included in the Hispanic category. All other races are non-Hispanic. Note: This graph contains weighted results. Missouri - YRBS, 2017 - QN32
Percentage of High School Students Who Currently Smoked Cigarettes,* 1995-2017† *On at least 1 day during the 30 days before the survey †Decreased 1995-2017 [Based on linear and quadratic trend analyses using logistic regression models controlling for sex, race/ethnicity, and grade (p < 0.05). Significant linear trends (if present) across all available years are described first followed by linear changes in each segment of significant quadratic trends (if present).] Data not available for 2011. Note: This graph contains weighted results. Missouri - YRBS, 1995-2017 - QN32
Percentage of High School Students Who Currently Smoked Cigarettes Frequently,* by Sex, Grade,† and Race/Ethnicity, 2017 *On 20 or more days during the 30 days before the survey †12th > 9th, 12th > 10th (Based on t-test analysis, p < 0.05.) All Hispanic students are included in the Hispanic category. All other races are non-Hispanic. Note: This graph contains weighted results. Missouri - YRBS, 2017 - QNFRCIG
Percentage of High School Students Who Currently Smoked Cigarettes Frequently,* 1995-2017† *On 20 or more days during the 30 days before the survey †Decreased 1995-2017, no change 1995-2001, decreased 2001-2017 [Based on linear and quadratic trend analyses using logistic regression models controlling for sex, race/ethnicity, and grade (p < 0.05). Significant linear trends (if present) across all available years are described first followed by linear changes in each segment of significant quadratic trends (if present).] Data not available for 2011. Note: This graph contains weighted results. Missouri - YRBS, 1995-2017 - QNFRCIG
Percentage of High School Students Who Currently Smoked Cigarettes Daily,* by Sex, Grade,† and Race/Ethnicity, 2017 *On all 30 days during the 30 days before the survey †12th > 9th (Based on t-test analysis, p < 0.05.) All Hispanic students are included in the Hispanic category. All other races are non-Hispanic. Note: This graph contains weighted results. Missouri - YRBS, 2017 - QNDAYCIG
Percentage of High School Students Who Currently Smoked Cigarettes Daily,* 1995-2017† *On all 30 days during the 30 days before the survey †Decreased 1995-2017, decreased 1995-2007, decreased 2007-2017 [Based on linear and quadratic trend analyses using logistic regression models controlling for sex, race/ethnicity, and grade (p < 0.05). Significant linear trends (if present) across all available years are described first followed by linear changes in each segment of significant quadratic trends (if present).] Data not available for 2011. Note: This graph contains weighted results. Missouri - YRBS, 1995-2017 - QNDAYCIG
Percentage of High School Students Who Ever Used an Electronic Vapor Product,* by Sex, Grade,† and Race/Ethnicity, 2017 *Including e-cigarettes, e-cigars, e-pipes, vape pipes, vaping pens, e-hookahs, and hookah pens [such as blu, NJOY, Vuse, MarkTen, Logic, Vapin Plus, eGo, and Halo] †11th > 9th, 11th > 10th, 12th > 9th, 12th > 10th (Based on t-test analysis, p < 0.05.) All Hispanic students are included in the Hispanic category. All other races are non-Hispanic. Note: This graph contains weighted results. Missouri - YRBS, 2017 - QN34
Percentage of High School Students Who Ever Used an Electronic Vapor Product,* 2015-2017† *Including e-cigarettes, e-cigars, e-pipes, vape pipes, vaping pens, e-hookahs, and hookah pens [such as blu, NJOY, Vuse, MarkTen, Logic, Vapin Plus, eGo, and Halo] †No change 2015-2017 [Based on linear trend analyses using logistic regression models controlling for sex, race/ethnicity, and grade (p < 0.05).] Note: This graph contains weighted results. Missouri - YRBS, 2015-2017 - QN34
Percentage of High School Students Who Currently Used an Electronic Vapor Product,* by Sex,† Grade,† and Race/Ethnicity,† 2017 *Including e-cigarettes, e-cigars, e-pipes, vape pipes, vaping pens, e-hookahs, and hookah pens [such as blu, NJOY, Vuse, MarkTen, Logic, Vapin Plus, eGo, and Halo], on at least 1 day during the 30 days before the survey †M > F; 10th > 9th, 11th > 9th, 12th > 9th; W > B (Based on t-test analysis, p < 0.05.) All Hispanic students are included in the Hispanic category. All other races are non-Hispanic. Note: This graph contains weighted results. Missouri - YRBS, 2017 - QN35
Percentage of High School Students Who Currently Used an Electronic Vapor Product,* 2015-2017† *Including e-cigarettes, e-cigars, e-pipes, vape pipes, vaping pens, e-hookahs, and hookah pens [such as blu, NJOY, Vuse, MarkTen, Logic, Vapin Plus, eGo, and Halo], on at least 1 day during the 30 days before the survey †Decreased 2015-2017 [Based on linear trend analyses using logistic regression models controlling for sex, race/ethnicity, and grade (p < 0.05).] Note: This graph contains weighted results. Missouri - YRBS, 2015-2017 - QN35
Percentage of High School Students Who Usually Got Their Own Electronic Vapor Products by Buying Them in a Store,* by Sex, Grade, and Race/Ethnicity, 2017 *Such as a convenience store, supermarket, discount store, gas station, or vape store, during the 30 days before the survey, among students who currently used electronic vapor products and who were aged <18 years All Hispanic students are included in the Hispanic category. All other races are non-Hispanic. Missing bar indicates fewer than 100 students in this subgroup. Note: This graph contains weighted results. Missouri - YRBS, 2017 - QN36
Percentage of High School Students Who Currently Used Smokeless Tobacco,* by Sex,† Grade,† and Race/Ethnicity, 2017 *Chewing tobacco, snuff, dip, snus, or dissolvable tobacco products [such as Redman, Levi Garrett, Beechnut, Skoal, Skoal Bandits, Copenhagen, Camel Snus, Marlboro Snus, General Snus, Ariva, Stonewall, or Camel Orbs], not counting any electronic vapor products, on at least 1 day during the 30 days before the survey †M > F; 12th > 9th (Based on t-test analysis, p < 0.05.) All Hispanic students are included in the Hispanic category. All other races are non-Hispanic. Note: This graph contains weighted results. Missouri - YRBS, 2017 - QN37
Percentage of High School Students Who Currently Smoked Cigars,* by Sex,† Grade,† and Race/Ethnicity, 2017 *Cigars, cigarillos, or little cigars, on at least 1 day during the 30 days before the survey †M > F; 10th > 9th, 11th > 9th, 12th > 9th, 12th > 10th (Based on t-test analysis, p < 0.05.) All Hispanic students are included in the Hispanic category. All other races are non-Hispanic. Note: This graph contains weighted results. Missouri - YRBS, 2017 - QN38
Percentage of High School Students Who Currently Smoked Cigars,* 1999-2017† *Cigars, cigarillos, or little cigars, on at least 1 day during the 30 days before the survey †Decreased 1999-2017 [Based on linear and quadratic trend analyses using logistic regression models controlling for sex, race/ethnicity, and grade (p < 0.05). Significant linear trends (if present) across all available years are described first followed by linear changes in each segment of significant quadratic trends (if present).] Data not available for 2011. Note: This graph contains weighted results. Missouri - YRBS, 1999-2017 - QN38


